
Bitcoin Price Key Highlights
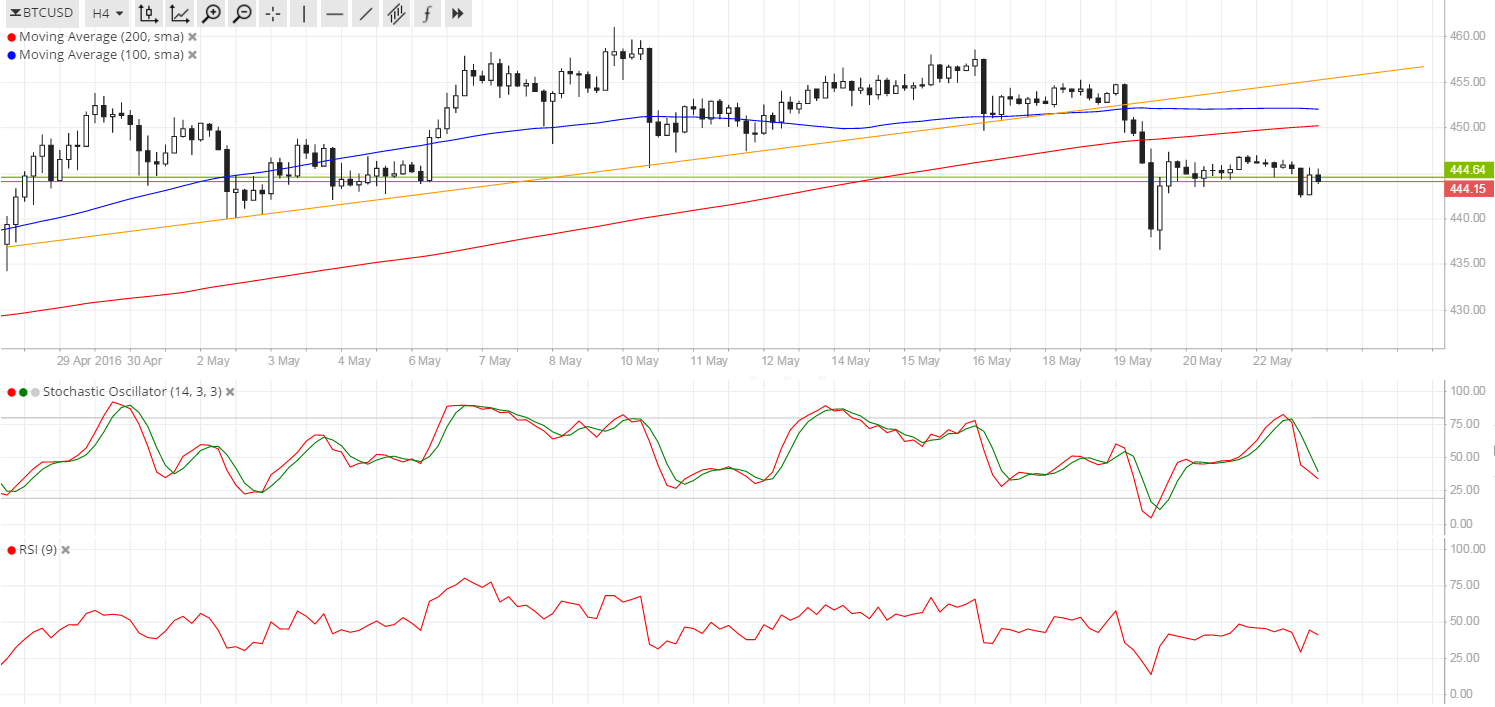
- Bitcoin price recently made a break below the triangle consolidation pattern as illustrated in the previous update.
- Price rebounded off the $436 area and is showing a possible correction play.
- Any of the nearby inflection points might hold as resistance, all the way up to the broken support at $455.
Bitcoin price is pulling up from its recent dive, offering a better entry point for sellers looking to catch the downtrend.
Technical Indicators Signals
The 100 SMA is above the 200 SMA on the 4-hour time frame so the path of least resistance might still be to the upside, generating more gains for bitcoin price. However, the gap between the moving averages is narrowing so a downward crossover could be seen later on, drawing more bears to the mix.
Stochastic is already on the move down from the overbought area, indicating that selling pressure is starting to kick in. RSI, on the other hand, is treading around middle ground.
A higher pullback could last until the moving averages just above $450 or all the way up to the broken triangle support at $455. If these areas hold as resistance, bitcoin price could revisit the recent lows at $436 or create new ones closer to $430.

Market Events
Last week’s release of the FOMC minutes was mostly responsible for the dollar’s gains against bitcoin price, as policymakers shared their optimistic views and revived speculations of a June rate hike. In addition, testimonies from FOMC voting members also supported potential tightening in June or July.
Risk aversion also favored the lower-yielding dollar, thanks to more signs of a slowdown in China and some of the major economies. This weighed on demand for the higher-yielding bitcoin and might continue to do so in the coming days.
There aren’t much top-tier reports out of the US economy this week, which suggests that the current market environment could keep affecting bitcoin price action. A sudden return to risk-taking, however, could put bitcoin back above the triangle support and on its way to test the highs at $470.
Charts from SimpleFX
Image courtesy of NewsBTC