

Bitcoin Price Key Highlights
- Bitcoin price has formed higher lows and found resistance at the $470 level, creating an ascending triangle pattern on its daily chart.
- Price just bounced off the triangle support and is due for a test of resistance once more.
- Technical indicators are signaling that further gains are possible.
Bitcoin price is still inside its long-term triangle consolidation pattern and might make another test of the resistance.
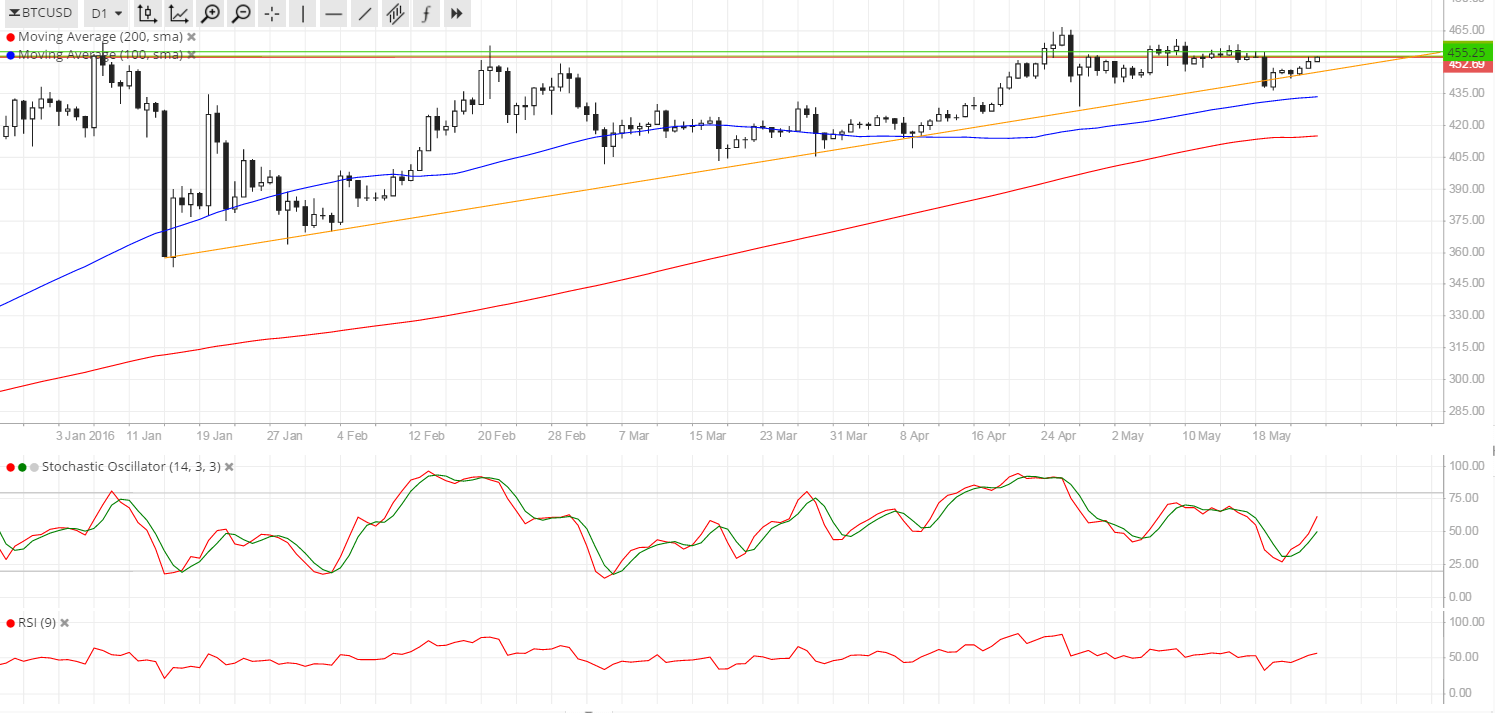
Technical Indicators Signals
The 100 SMA is above the 200 SMA so the path of least resistance is still to the upside. A sharp move lower could find support at the triangle bottom around $450 or until the dynamic support at the 100 SMA.
Stochastic is on the move up to indicate that bulls are in control of bitcoin price action, likely with enough energy to take it back up to $470 or perhaps even higher. If so, a longer-term uptrend could ensue, bringing bitcoin price to the previous year highs closer to $500.
A bit of a bullish divergence can be seen as stochastic made lower lows while price made higher lows, adding confirmation that buyers are ready to get back in the game. Meanwhile, RSI is treading sideways on middle ground so the consolidation could carry on.

Market Events
The lack of top-tier releases from the US economy has allowed risk sentiment to dictate bitcoin price action for the past few days. So far, risk appetite has been present thanks to the continued rally in crude oil prices.
However a return to dollar demand could be seen once the US economy starts printing upbeat data. Recall that Fed officials have specified that the June decision will be data-dependent and that a rate hike could still be a possibility, even though there might be risks stemming from a potential Brexit and weaker inflation expectations.
If signs point to the Fed sitting on its hands for June and waiting for the July meeting instead, the US dollar could continue to lose ground to bitcoin and open the possibility of an upside breakout from the longer-term triangle pattern. But until the Fed does take action, further consolidation could be seen.
Charts from SimpleFX
Header Image via NewsBTC