

Bitcoin Price Key Highlights
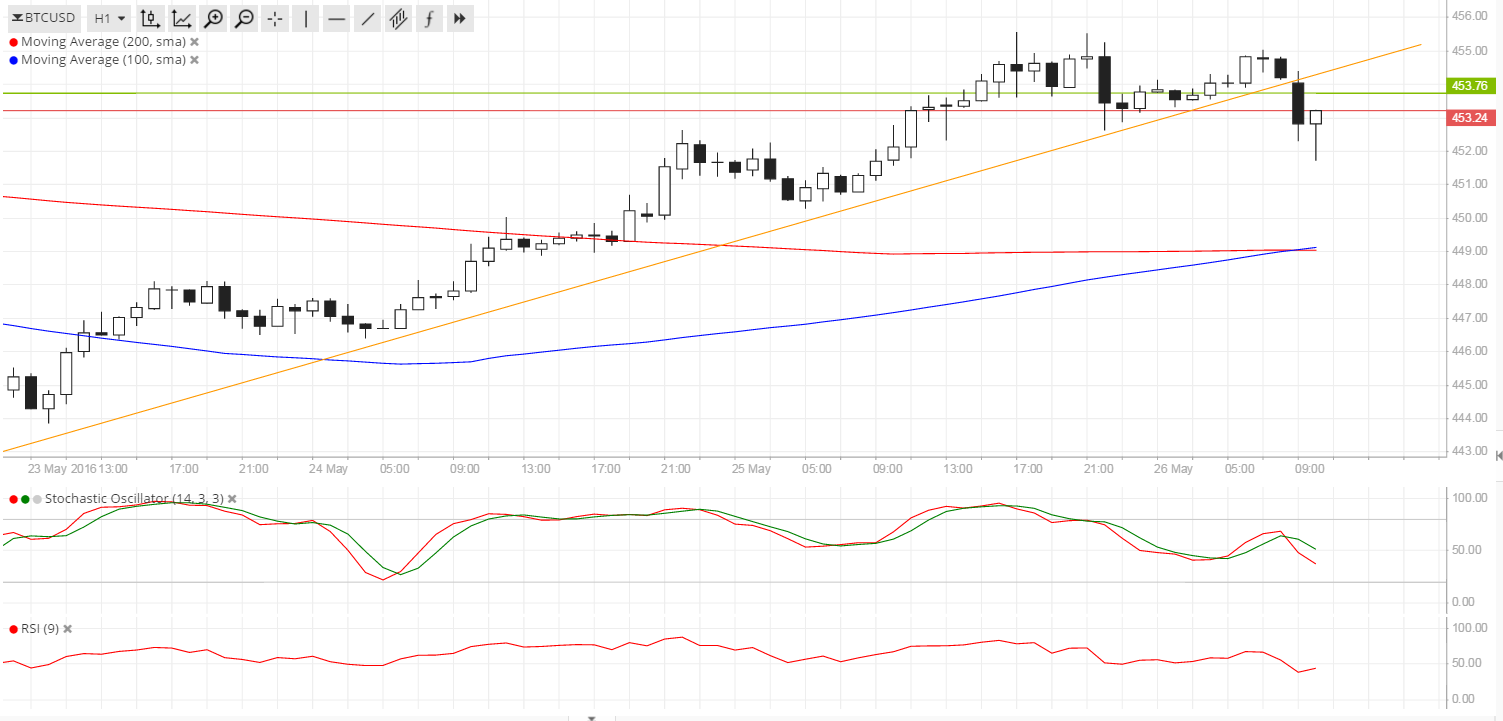
- Bitcoin price had been moving above an ascending trend line on its 1-hour time frame.
- Price just made a downside break of support as risk aversion seems to be back in the financial markets.
- This could be an early signal of a pending selloff, although technical indicators are still giving mixed signs.
Bitcoin price made a break of the short-term trend line support, signaling a potential selloff from here.
Technical Indicators Signals
The 100 SMA is starting to cross above the longer-term 200 SMA, which suggests potentially stronger buying pressure. If so, bitcoin price could land back above the rising trend line and carry on with its climb.
Stochastic, however, is on the move down and indicating that sellers are taking control. In that case, bitcoin price could have room to head south until the next area of interest around $450. This is also near the moving averages, which might hold as dynamic support levels.
RSI is still treading on middle ground, barely offering any strong directional clues for now. This means that consolidation could also be on the table, keeping bitcoin between the current support and the nearby resistance at $455.

Market Events
The lack of top-tier reports from the US economy have left risk sentiment in charge of bitcoin price action so far this week. The higher-yielding asset has moved in tandem with equities, which have been posting some gains so far. However, this breakdown suggests that a reversal could be possible
The US is set to print data on durable goods orders today, with analysts expecting to see 0.3% gains for both the headline and core version of the report. Also lined up today are the initial jobless claims and pending home sales reports. Data form the US economy came in weaker than expected yesterday, as the flash services PMI slipped from 52.8 to 51.2 instead of improving to the estimated 53.1 figure.
A bigger market mover could be the preliminary GDP release from the US on Friday, as traders are counting on an upward revision from 0.5% to 0.8% to indicate stronger growth and possibly yield more dollar gains.
Charts from SimpleFX
Header Image NewsBTC