Bitcoin Price Key Highlights
- Bitcoin price is still in correction mode from its strong rally in the previous week.
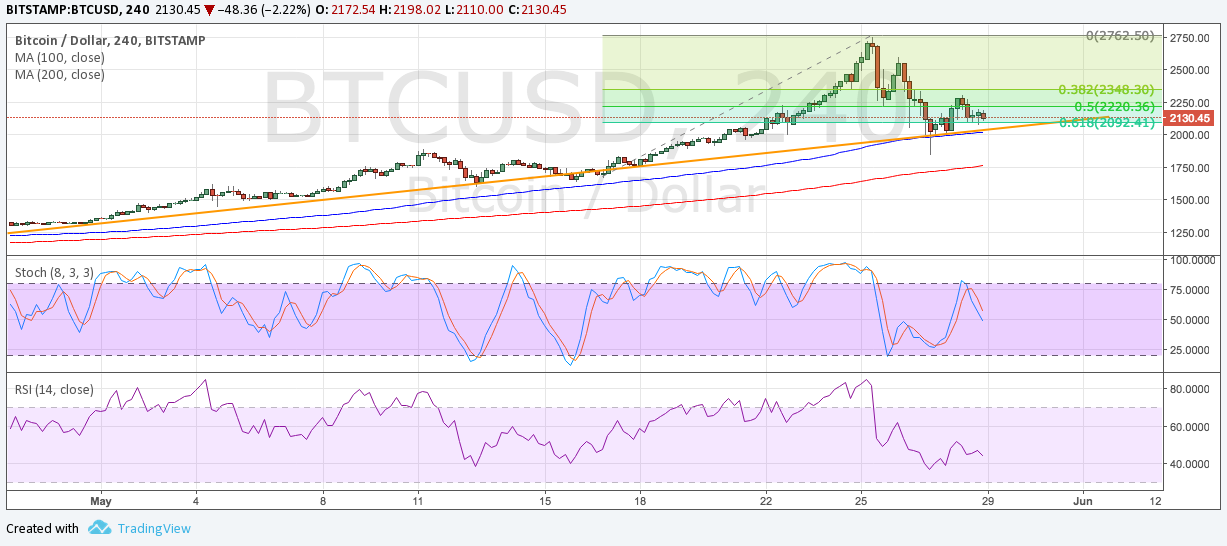
- Price is now testing the ascending trend line connecting the lows since the start of the month.
- This support zone also lines up with several inflection points and might be the line in the sand for this uptrend.
Bitcoin price is currently testing an area of interest on its 4-hour time frame and is still deciding whether to bounce or to break.
Technical Indicators Signals
The 100 SMA is above the longer-term 200 SMA so the path of least resistance is to the upside. The shorter-term moving average lines up with the rising trend line support, adding to its strength as a floor.
In addition, applying the Fib tool on the latest swing low and high shows that the 61.8% level lines up with this support area. A break below the $2100 level could lead to a drop to the 200 SMA, which might be the last line of the defense in this climb.
Oscillators are giving mixed signals, with stochastic turning down to indicate that sellers are in control of price action. On the other hand, RSI already appears to be turning higher to show that buyers are regaining control of bitcoin price action.

Market Factors
The selloff in the past couple of days represents a much-needed correction from the almost nonstop bitcoin price climb in the past week. This signals that several traders have booked profits off the recent highs, especially since geopolitical risks seem to be subsiding and speculations of a bubble are getting stronger.
While last week’s rally was also fueled by a couple of big conventions in the bitcoin arena, speculators seem to have run out of steam in terms of taking price higher from here. Keep in mind that a lot of the cryptocurrency’s movements are driven mostly by demand and speculation and there’s nothing new to go on from here so the correction could stay in play for a while.