Bitcoin Price Key Highlights
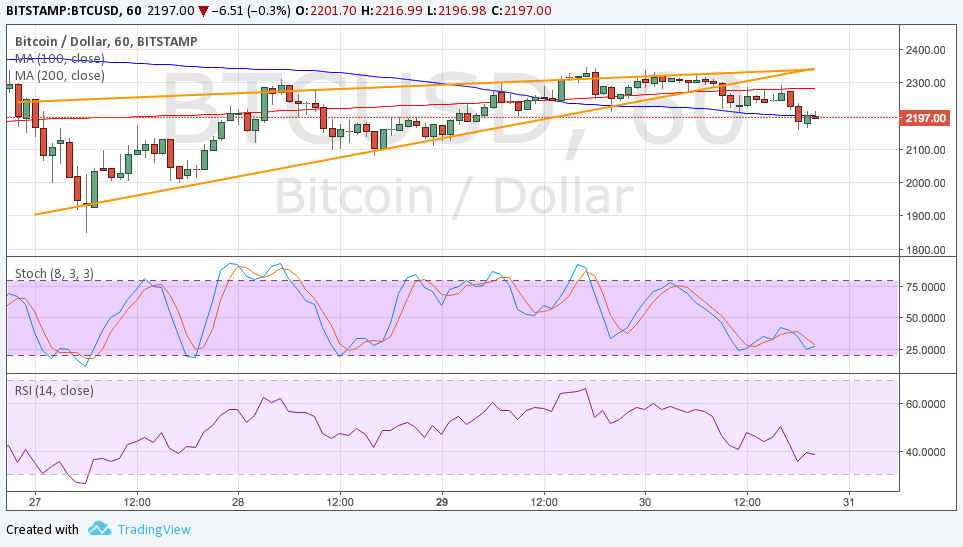
- Bitcoin price recently broke below a rising wedge consolidation pattern, signaling that further losses are in the cards.
- The wedge pattern spans $1900 to $2300 so the resulting selloff could be of the same size, taking bitcoin back to the $1900 area again.
- Technical indicators are showing that bearish pressure is still in play.
Bitcoin price broke below a short-term wedge consolidation pattern to signal a pickup in bearish pressure.
Technical Indicators Signals
The 100 SMA just crossed below the longer-term 200 SMA to indicate that the path of least resistance is to the downside. In addition, the 200 SMA is close to the broken wedge support, which might hold as resistance in the event of a quick pullback. The gap between the moving averages is widening to reflect strengthening bearish momentum.
Stochastic is still on its way down to indicate that selling pressure is still in play. Similarly RSI is heading south so bitcoin price might follow suit. However, if buyers regain control, bitcoin price could bust past the $2300 mark and set its sights back on its all-time highs closer to $2800.

Market Factors
The lack of market-moving catalysts for bitcoin kept it in consolidation mode for yet another day. This follows the strong rally last week and the sharp profit-taking that occurred soon after. Investors continue to hold out for the next directional play, which could either be up or down.
Meanwhile, US dollar demand appears to have been revived by increased Fed rate hike odds for June. This comes after a stronger than expected core PCE price index reading that indicated slightly higher price pressures. However, FOMC voting member Brainard cast some doubts on a September hike in her recent speech.
Moving forward, bitcoin price could continue to move sideways in the absence of big catalysts for the dollar or cyptocurrencies. Risks on the docket include the UK snap elections, Greek debt drama, and the Italian banking crisis – all of which could shore up demand for bitcoin as uncertainty stays in play.