Bitcoin Price Key Highlights
- Bitcoin price appears to be taking a break from its sharp climb, offering buyers an opportunity to catch the uptrend on a pullback.
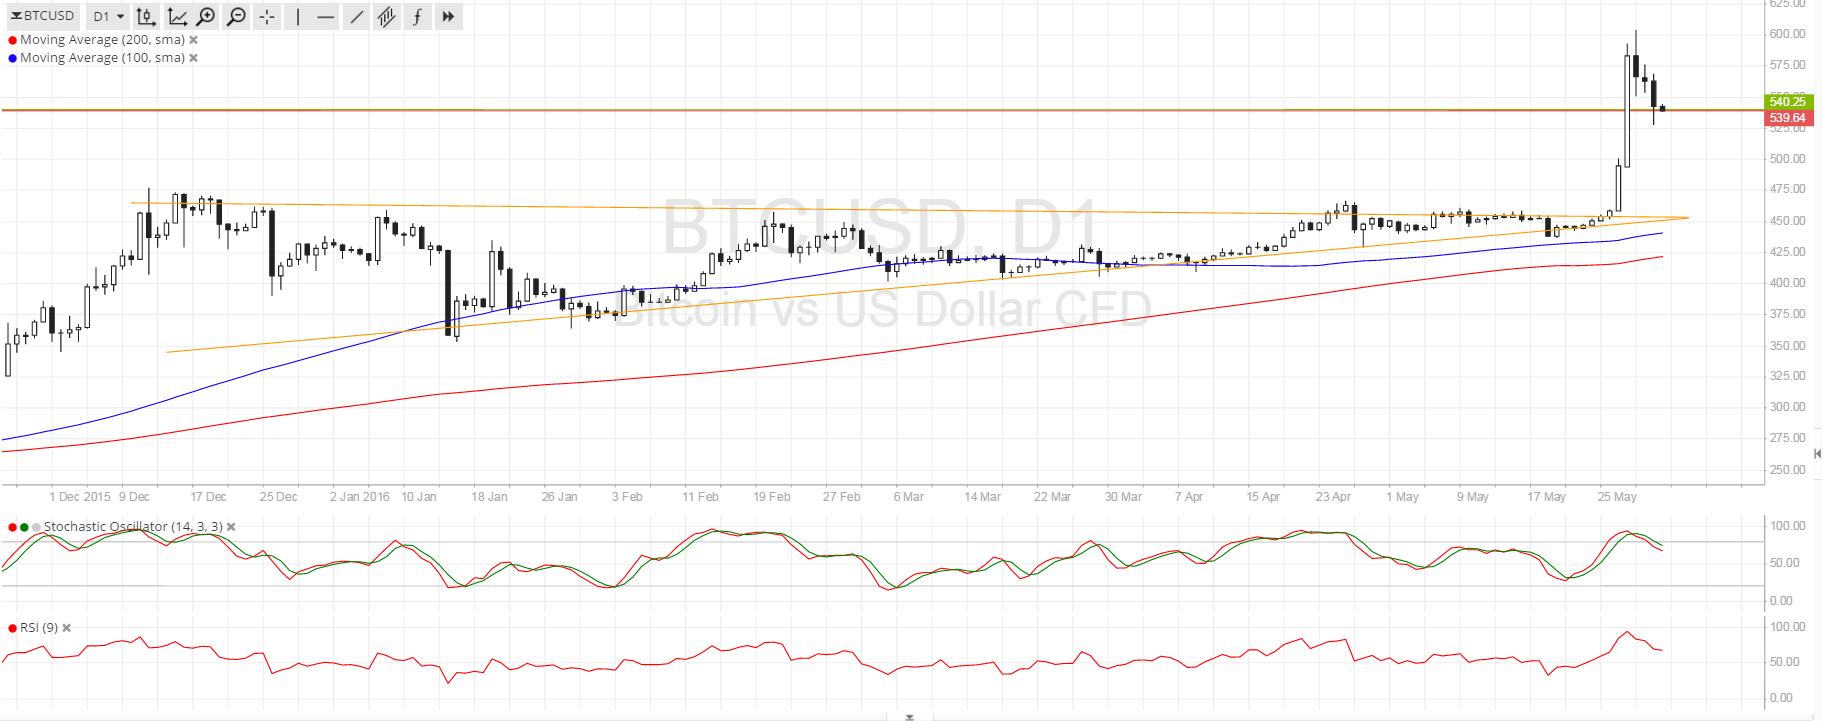
- Bitcoin recently broke out of a symmetrical triangle formation and has surged past the previous year highs at $500.
- Price peaked at $600 before showing signs of a correction.
Bitcoin price could pull back as low as the broken triangle resistance before resuming its climb, as technical indicators are hinting at a quick selloff.
Technical Indicators Signals
The 100 SMA is above the 200 SMA for now, confirming that the longer-term path of least resistance is to the upside. However, the gap between the moving averages is narrowing so a downward crossover could be imminent. Still, the moving averages are close to the former triangle support, and this might be the line in the sand for any large correction.
Stochastic is on the move down, which means that bears are taking control of bitcoin price or that profit-taking among buyers is happening. Similarly, RSI is on the move down to indicate the presence of bearish momentum. This could go on until the broken triangle resistance around $450-475 or until the previous year highs at $500. Once bulls are back in the game, a climb back to the $600 mark could be in order.

Market Events
The return of US and UK traders from their long weekend holidays have revived demand for the safe-haven US dollar, particularly when opinion polls suggested a shift in favor of a Brexit. This could mean more uncertainty for the UK and global economy, thereby propping up demand for lower-yielding and less risky holdings like the dollar.
Still, demand for cryptocurrencies remains intact, especially after Chinese investors have put a lot of funds in bitcoin owing to the government’s efforts to weaken the yuan and impose capital controls.
Moving forward, US data releases could add volatility to the mix, as the non-farm payrolls report is due on Friday and traders are on the lookout for strong data which might seal the deal for a Fed rate hike this month or the next.
Charts from SimpleFX