Bitcoin Price Key Highlights
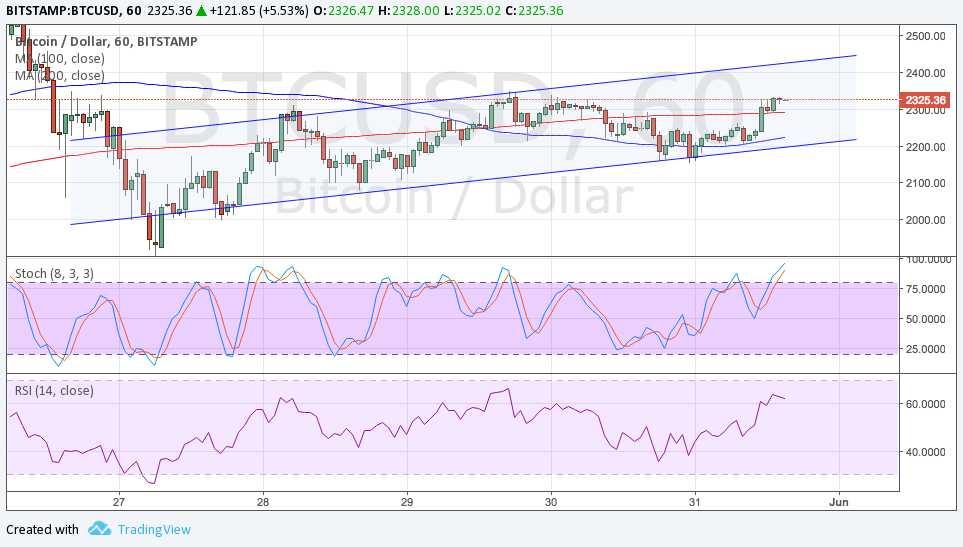
- Bitcoin price bounced off support of an ascending channel forming on its 1-hour time frame.
- This signals that buying pressure is coming back into play and may take price back up to the resistance at $2400 or higher.
- Technical indicators, however, are suggesting that bears are still on top of their game.
Bitcoin recently broke below a short-term rising wedge formation but bulls don’t seem ready to give up just yet.
Technical Indicators Signals
The 100 SMA is below the longer-term 200 SMA on this 1-hour chart, signaling that the path of least resistance is to the downside. However, the gap between the moving averages is narrowing to show a potential upside crossover and return in buying momentum.
Stochastic is on the move up, also indicating that buyers are in control, but the oscillator is nearing the overbought zone to reflect rally exhaustion. Once this oscillator turns lower, selling pressure could return and spur another test of the channel support at $2200, which is also close to the 100 SMA dynamic support.
RSI is on the move up but seems to be turning down from its climb, suggesting that bears are eager to get back in and possibly trigger a downside break of support.

Market Factors
There haven’t been a lot of developments on the bitcoin front recently, which explains the drop in volatility after last week’s bitcoin price surge. Although market factors such as geopolitical risk and the recent developments in the scaling issue remain in support of bitcoin, investors seem to be holding out for more convincing catalysts before taking the cryptocurrency out for another rally.
So far, the details on the scaling proposal that supposedly has support of 83% of bitcoin miners are still short. This could be one possible catalyst that might allow bitcoin price to go on a steeper climb. The latest update was that participants are working to put together a code but several startups have yet to pledge their support until their technical resources are aligned.
According to the proposal, the first software release is on June 16th so there’s a couple more weeks to go before bitcoin price enjoys more volatility. At that point, the open-source community can be able to give its feedback on the code.