Bitcoin Price Key Highlights
- Bitcoin price is pulling up from its recent slide but could be in for more gains if sellers hop in the short-term area of interest.
- Support at $555 was previously broken and might hold as resistance moving forward.
- Technical indicators, however, are suggesting that the climb could continue.
Bitcoin price appears to be correcting from its recent selloff but technical indicators are signaling that a longer-term bounce might be in order.
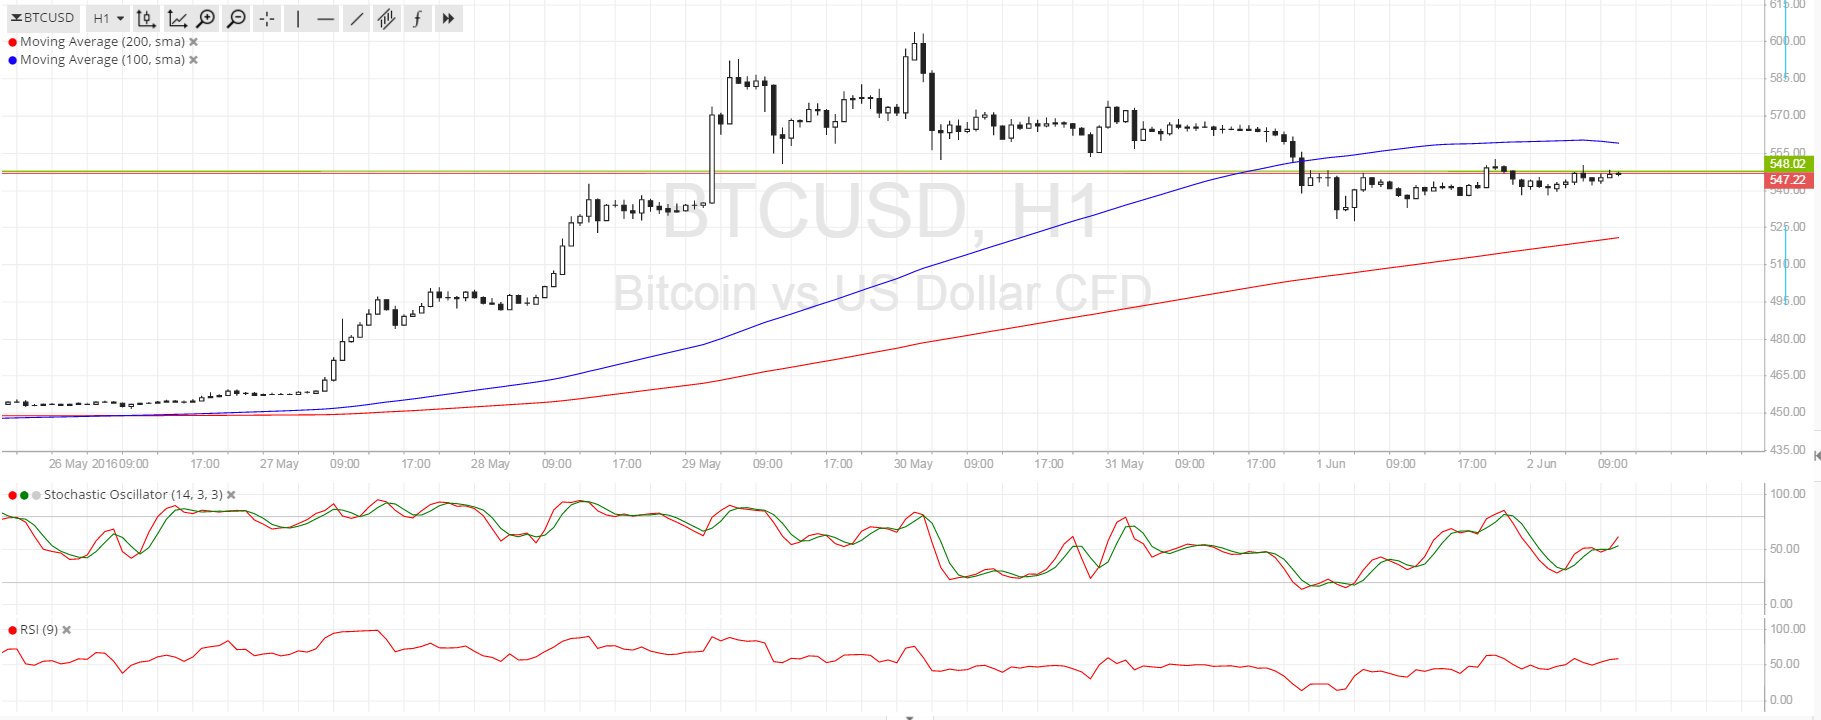
Technical Indicators Signals
The 100 SMA is safely above the 200 SMA so the path of least resistance is still to the upside. In that case, bitcoin price might be able to resume its rally to the previous highs around $600 and beyond if bullish pressure returns.
Stochastic is on the move up so bitcoin price might follow suit. RSI is gradually edging higher, confirming that buyers are starting to take control of price action. However, once these oscillators indicate overbought conditions, bears could get back in the game and push for declines.
The near-term resistance is located at $555, with reversal candles forming at this area likely to indicate another drop to the latest lows near $525. On the other hand, a long green candle closing past $555 could be indicative of a continuation of the climb to $600.

Market Events
The recent surge in bitcoin price was reportedly spurred by a rise in Chinese investors putting money on the cryptocurrency due to measures by the government to weaken the local currency and impose capital controls. However, these fears appear to have subsided, allowing some market participants to book profits off their long positions.
In addition, the US dollar appears to be regaining appeal ahead of the NFP release this week. Analysts are expecting to see a 163K gain in hiring for May but a stronger than expected result could revive June hike expectations and lead to sharp gains for the Greenback.
In terms of downside, bitcoin traders could take the cryptocurrency as low as the 2015 highs of $500 if profit-taking persists. Keep in mind that network congestion issues are still limiting bitcoin price gains lately, leading some investors to consider other virtual currencies.
Charts from SimpleFX