Bitcoin Price Key Highlights
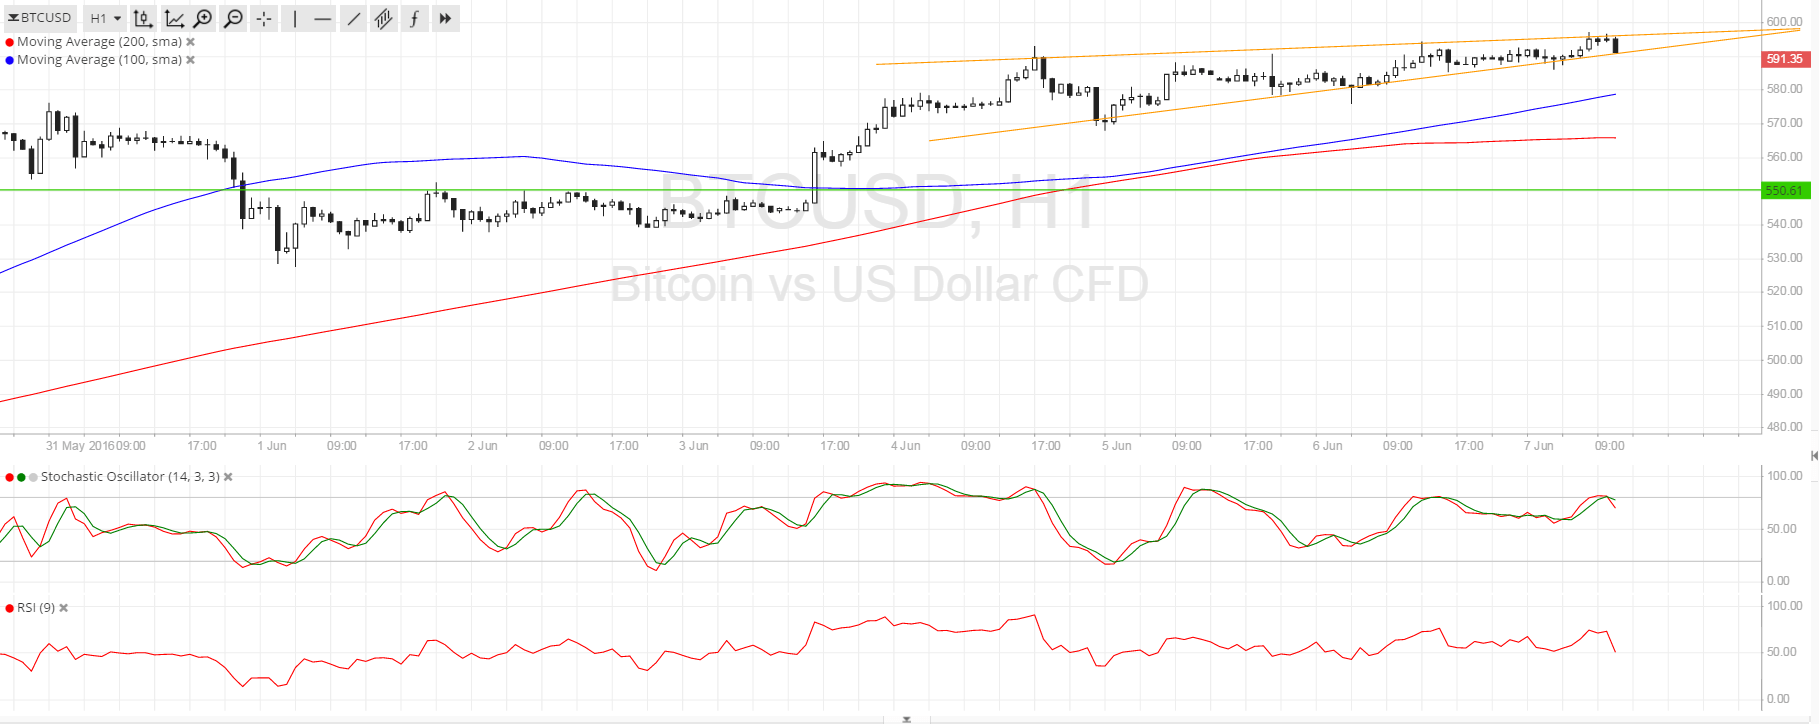
- Bitcoin price is still stuck in consolidation, moving inside a rising wedge pattern visible on the 1-hour time frame.
- Buyers and sellers are still tugging in their own directions, with a strong breakout likely to indicate where longer-term price action could go next.
- Technical indicators are giving mixed signals, with oscillators suggesting that a downside break could occur.
Bitcoin price could be headed for some losses if it does break below the bottom of the rising wedge as the oscillators suggest.
Technical Indicators Signals
Stochastic has already reached the overbought area, indicating an exhaustion in bullish pressure, and is starting to head south so bitcoin price could follow suit. Similarly, RSI is turning lower and indicating a return in selling momentum, which might lead to a downside breakout and further declines.
A candle closing below the $585-590 area could be enough to confirm a wedge breakdown and a possible selloff to the next support level at $550, which previously served as resistance for an earlier consolidation pattern. Stronger selling pressure could push bitcoin price below this area onto the next major support at $550.
On the other hand, a candle closing past the $600 level could put bitcoin price on track for more gains, possibly until the next key resistance at $700, visible on longer-term time frames. The 100 SMA is above the 200 SMA anyway so the path of least resistance is to the upside, especially with the gap between the moving averages widening to indicate stronger bullish momentum.

Market Events
Fed Chairperson Yellen’s testimony kept the downside pressure on the dollar, allowing bitcoin price to stay afloat. She expressed her disappointment over the latest NFP report and gave a somewhat cautious statement, signaling that she could prefer to keep rates on hold in this month’s FOMC decision.
This appears to be supporting risk appetite for now, as is the case for equities. This could extend to support for higher-yielding and riskier assets like bitcoin, especially since commodities are also taking part in the anti-dollar rallies. There are no major events from the US economy for the rest of the week but this sentiment could keep bitcoin price supported for the next few days.
Charts from SimpleFX