Bitcoin Price Key Highlights
- Bitcoin price has been trending higher recently, signaling that bulls are trying to push past the latest highs at $600.
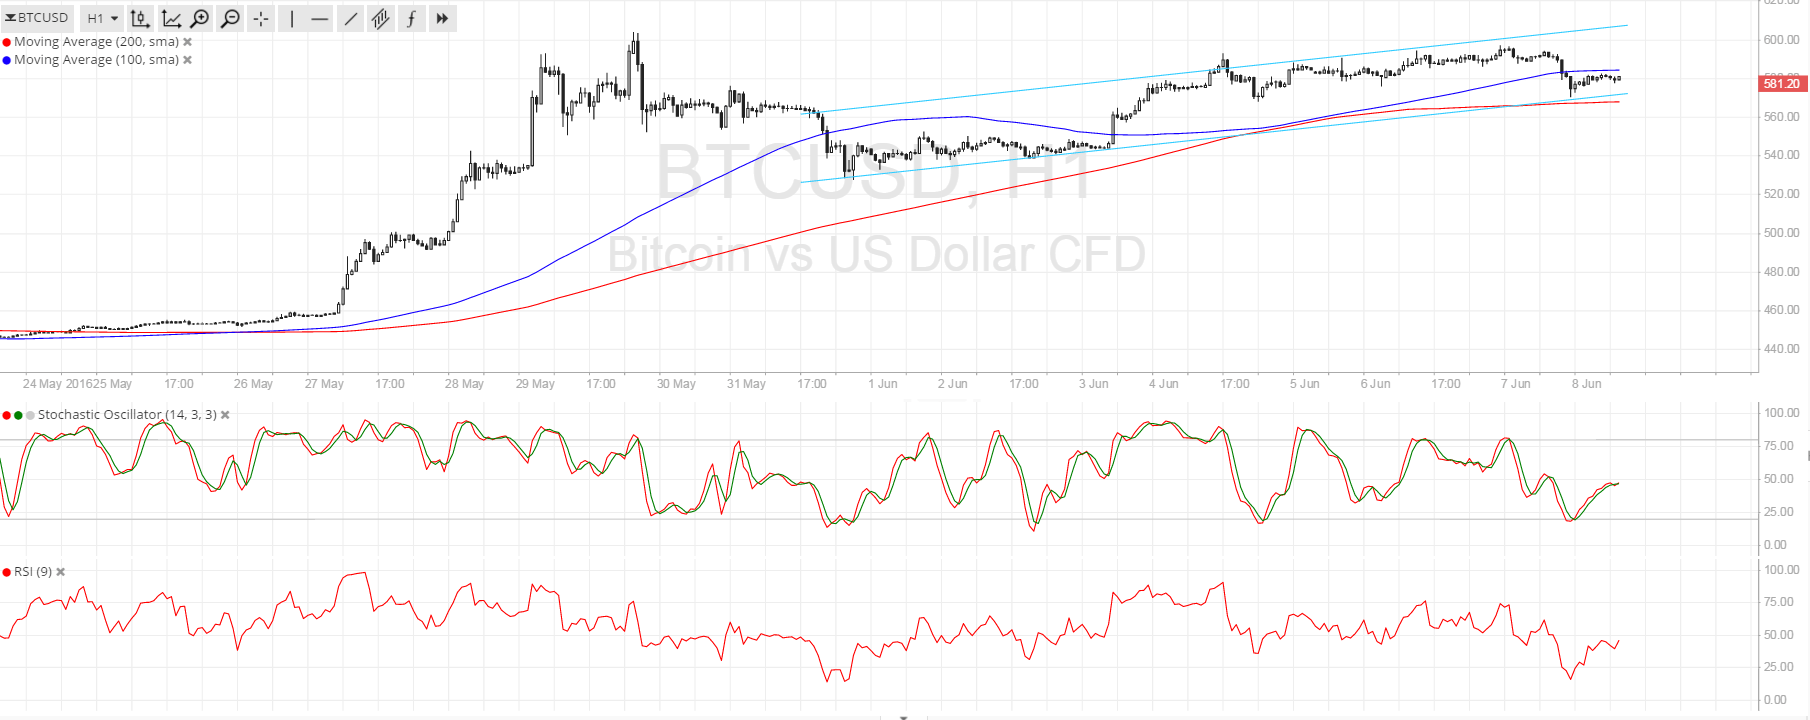
- An ascending channel can be drawn to connect the highs and lows since the start of the month and bitcoin price is testing support.
- A bounce could lead to another test of $600 but a break lower could complete a longer-term reversal pattern.
Bitcoin price is at a crossroads, with traders still deciding whether to keep up the uptrend or to start a long-term selloff.
Technical Indicators Signals
The 100 SMA is above the 200 SMA and is around the channel support, which might hold as a dynamic support level. However, a move below this area could lead to the creation of a double top formation with the neckline around $540-550. Further selling pressure could lead to a downside break of the neckline and a continuation of the longer-term drop to the visible support at $450-500.
Stochastic is on the move up, indicating that bulls are taking control of price action and are ready for a test of the channel resistance at $600. Similarly, RSI is on the climb so bitcoin price could follow suit.

Market Events
Volatility has subsided these days, following the strong bullish run of bitcoin price in late May. Price has stayed supported, thanks to lower expectations of a Fed rate hike this month or the next.
US economic data hasn’t been so impressive, particularly when it comes to the latest NFP release. The economy added only 38K in hiring for May, way below the 100K threshold and the estimated 159K figure. Still, non-farm productivity was revised from the initially reported 1.0% decline to just a 0.6% drop while unit labor costs were upgraded from 4.1% to 4.5% to show stronger wage pressures.
For today, the JOLTS job openings report is due and further evidence of employment weakness could mean more losses for the US dollar and consequently stronger gains for bitcoin price.
Charts from SimpleFX