Bitcoin Price Key Highlights
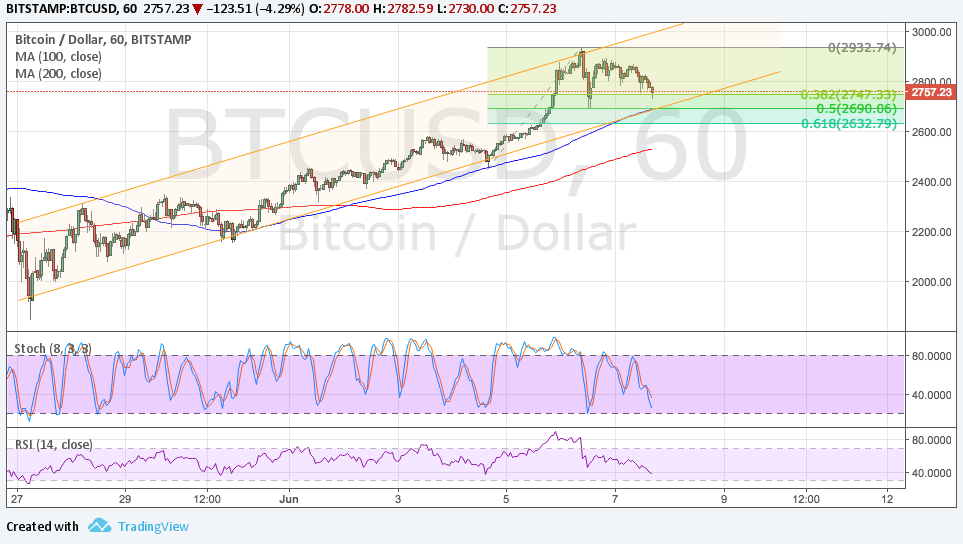
- Bitcoin price has been trending higher, moving inside what appears to be a rising channel on the 1-hour time frame.
- Price is currently in correction mode and could be due to test support again.
- If bulls defend this support area, bitcoin price could resume its climb to the recent highs or create new ones.
Bitcoin price is still pulling back from its latest rally, possibly attracting more bulls at the area of interest.
Technical Indicators Signals
The 100 SMA is safely above the longer-term 200 SMA on the 1-hour chart, signaling that the path of least resistance is to the upside. In addition, the 100 SMA dynamic support lines up with the bottom of the channel, adding to its strength as a floor.
This also coincides wit the 50% Fibonacci retracement level based on the latest swing low and high. A larger pullback could draw support from the 61.8% Fib at $2632 but a break below this area could lead more sellers to join in and spur a downtrend.
Stochastic is pointing down to indicate that sellers are in control of price action. RSI is also on the move down to reflect the presence of bearish momentum. However, once both oscillators hit the oversold area and turn higher, buying pressure could return and lead to a continuation of the ongoing uptrend.

Market Factors
The recent drop in bitcoin price is being blamed on Mark Cuban’s tweet as the investor said that the digital currency is more of a religion than an asset, citing that he doesn’t have a problem with value but with valuation. He also noted that bitcoin might be in a bubble, spooking some bulls and leading to more profit-taking activity.
Also, the dollar has regained some ground across the board on hopes that Comey won’t be dropping a bombshell on the Trump administration. His opening statement was published on the Senate website and it contained no clues that he had any damning evidence on Trump for sharing highly-classified intelligence information to Russian officials.