Bitcoin Price Key Highlights
- Bitcoin price has been slowly trending higher following its strong upside breakout last month.
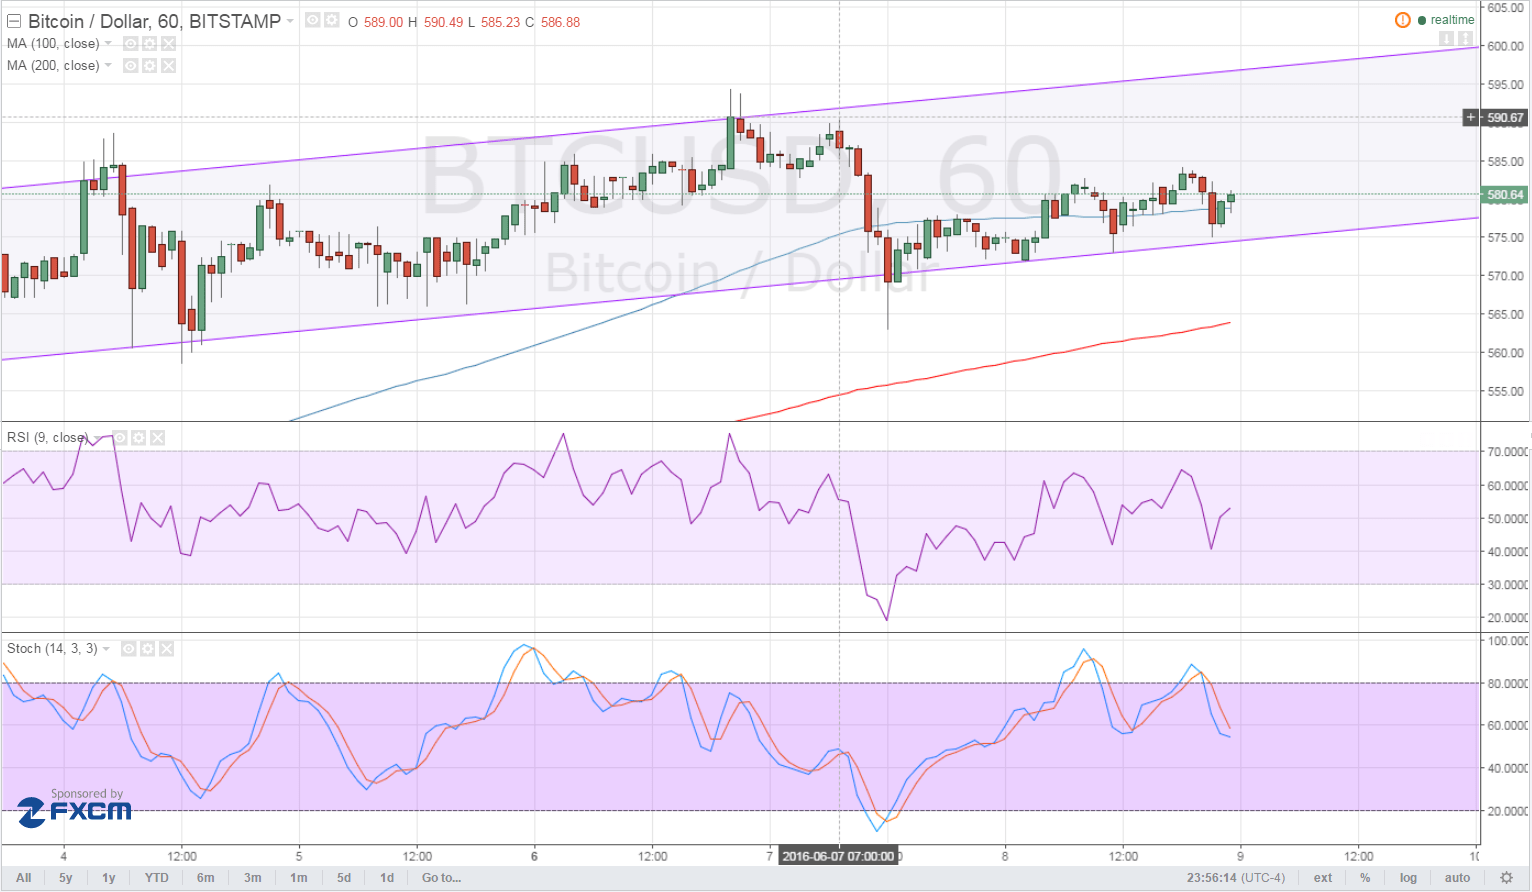
- Price is trading inside an ascending channel visible on its 1-hour time frame and is testing support.
- A bounce off this area could lead to a test of the resistance near $600 but a downside break could spur a longer-term selloff.
Bitcoin price is on a short-term uptrend and is still deciding whether to make a bounce or a break from support.
Technical Indicators Signals
The 100 SMA is above the 200 SMA so the path of least resistance is to the upside, indicating that buyers could be strong enough to push for a move towards the top of the channel. In addition, the 100 SMA lines up with the channel support and appears to be holding as a dynamic inflection point for now.
Oscillators are painting a mixed picture, though. RSI is on the move up to show that buyers are in control of bitcoin price action at the moment. However, stochastic is heading south so bitcoin price could follow suit if selling pressure continues to build up.
A break below the channel support could lead to a test of the nearby dynamic support at the 200 SMA or $565 while a stronger drop could pull it down to the longer-term area of interest at $540-550.

Market Events
The US dollar has lost a lot of appeal following the downbeat May NFP report and Yellen’s cautious remarks. Traders are pricing in lower odds of a Fed rate hike this month and the next and might be lightening up on their dollar holdings to the benefit of bitcoin.
In addition, market uncertainties are making virtual currencies more appealing versus fiat ones these days. The upcoming EU referendum has had forex brokers adjusting their margin requirements for several currency pairs higher as they anticipate a burst in volatility leading up to the event. This could lead investors to move their funds to alternative assets such as bitcoin.
Keep in mind also that uncertainty in the markets could also lead to quick profit-taking activity, as traders might not be willing to leave any risk on the table over the weekends.
Charts from TradingView