Bitcoin Price Key Highlights
- Bitcoin price made another break higher over the weekend, indicating strong bullish momentum.
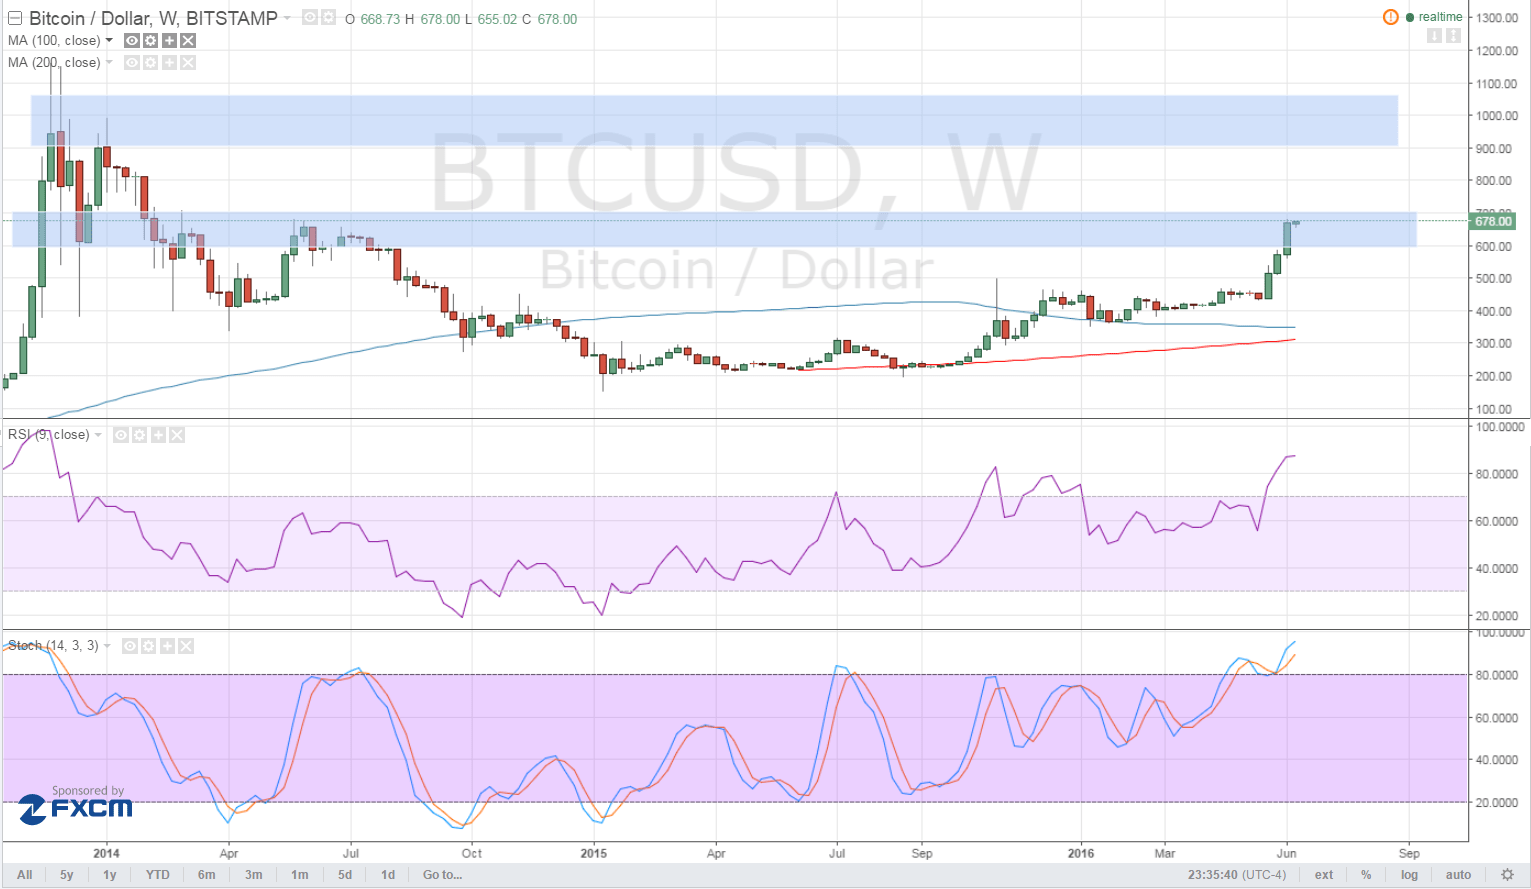
- Price is now testing another long-term area of interest around $700, at which either profit-taking or another upside breakout might be seen.
- Technical indicators are hinting that the rallies could pause but it would be helpful to look at the next potential resistance levels.
Bitcoin price has shown strong upside momentum over the past few weeks and might be eyeing a test of these next ceilings.
Technical Indicators Signals
The 100 SMA is above the 200 SMA for now so the path of least resistance is still to the upside. However, the gap between the moving averages is narrowing so a downward crossover might be possible, hinting at a potential return in bearish pressure.
In that case, bitcoin price could retreat from the current area of interest for a quick pullback to the nearby support at $500. RSI is also indicating overbought conditions, which means that buyers are exhausted and might let sellers take over from here.
Similarly, stochastic is in the overbought area but hasn’t crossed lower yet. This implies that while the rallies may be overextended, bulls aren’t quite ready to give in just yet and might have enough energy to take bitcoin price up to the next ceiling at $900-$1,000.

Market Events
Several uncertainties in the financial markets have drawn more and more traders to bitcoin last week. For one, this may have been a result of market watchers moving money out of the US dollar in anticipation of downbeat remarks from the FOMC statement this week. Keep in mind that the latest US jobs report was a huge disappointment so Fed officials could dial down their hawkish bias.
In addition, downbeat data released from China over the weekend drew more investors towards bitcoin, similar to the case on the last week of May. Industrial production was unchanged at 6.0% while fixed asset investment slumped from 10.5% to 9.6%. Retail sales also lagged from 10.1% to 10.0%.
To top it all off, the jitters ahead of the EU referendum are encouraging traders to dump their holdings of fiat currencies and seek alternative investments for now, thereby propping bitcoin price up.
Charts from TradingView