Bitcoin Price Key Highlights
- Bitcoin price could be in for a continuation of its bullish run after this chart pattern formed on its weekly time frame.
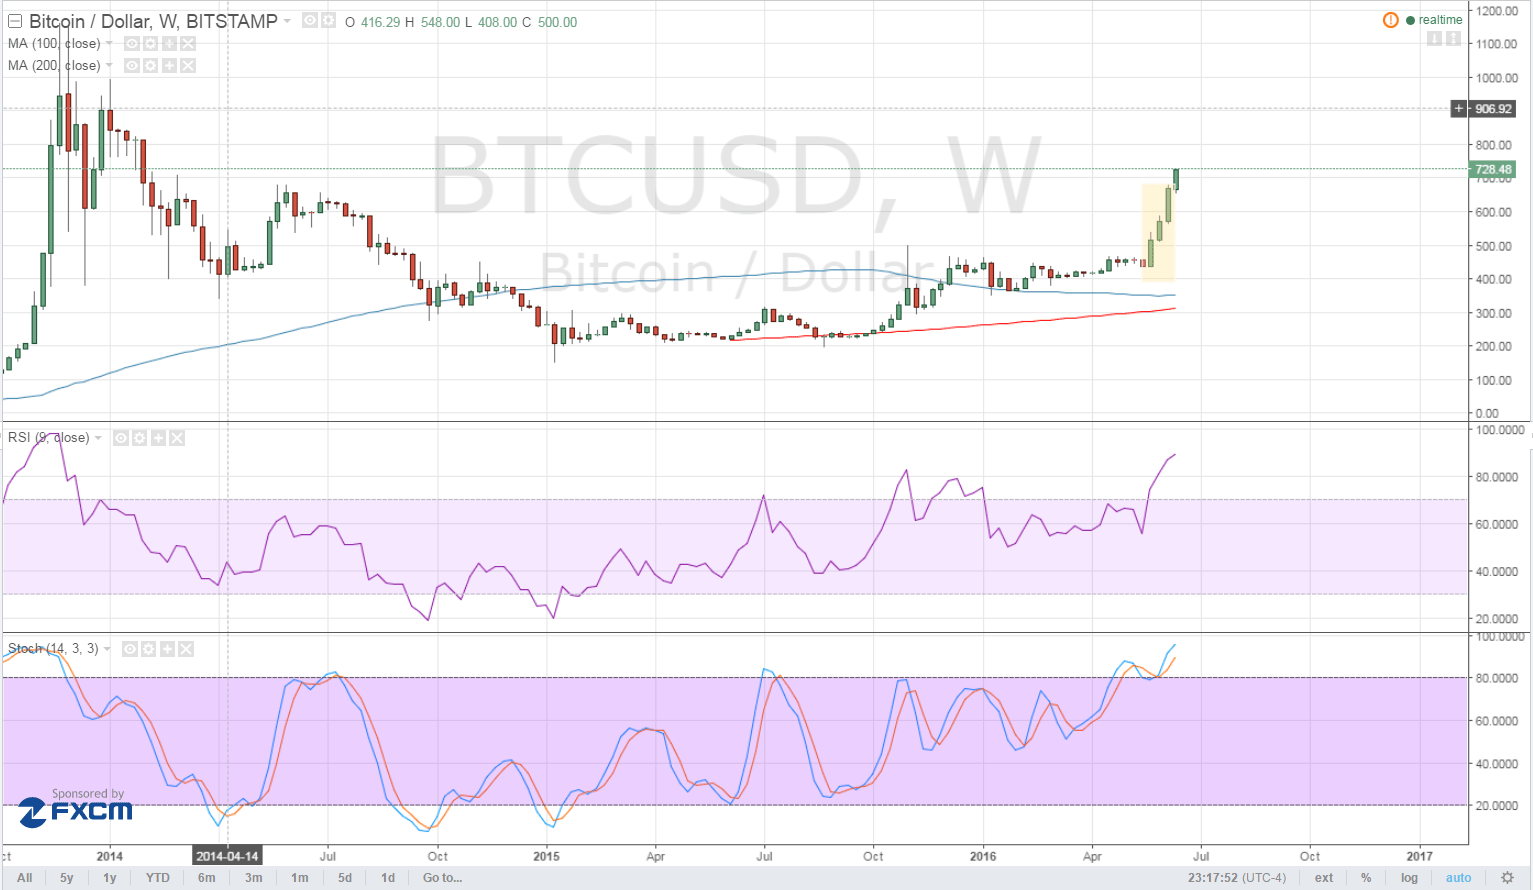
- A three white soldiers formation can be seen with those three bullish candlesticks after a brief period of consolidation.
- This signals that buyers aren’t done with their rallies, potentially taking bitcoin price to the next area of interest at $800-850 then onto $900-1,000.
Bitcoin price has formed a three white soldiers pattern on its weekly chart, confirming that further gains are in the cards.
Technical Indicators Signals
The 100 SMA is above the longer-term 200 SMA for now, confirming that the path of least resistance is to the upside. However, the gap between the moving averages is closing in so a downward crossover could still be imminent, indicating a potential turn in sentiment.
RSI is still in the overbought region but hasn’t turned lower, which means that bullish pressure might be weakening but that buyers haven’t given up yet. Similarly, stochastic has been indicating overbought conditions for quite some time but hasn’t crossed down to show a return in selling momentum. In a nutshell, this suggests that bulls are still very much in control of bitcoin price action.
On this time frame, it can be seen that price is already within the next area of interest, at which some profit-taking could be possible. Increased volumes could lead to rallies past this point and onto the next area of interest from $900-1,000.

Market Events
The FOMC decision has passed and yielded more gains for bitcoin price against the dollar as the Fed refrained from hiking interest rates. In addition, FOMC policymakers lowered their growth forecast for 2016 and 2017, reflecting a less hawkish outlook and dampening demand for the Greenback.
The next major event risk for bitcoin price is the EU referendum, as a potential Brexit could bring an influx of funds from Europe and onto alternative assets such as bitcoin. So far, demand from Chinese investors also remains strong as the weak data has convinced market watchers that the government could keep the yuan weak and might impose additional capital controls.
Charts from TradingView