Bitcoin Price Key Highlights
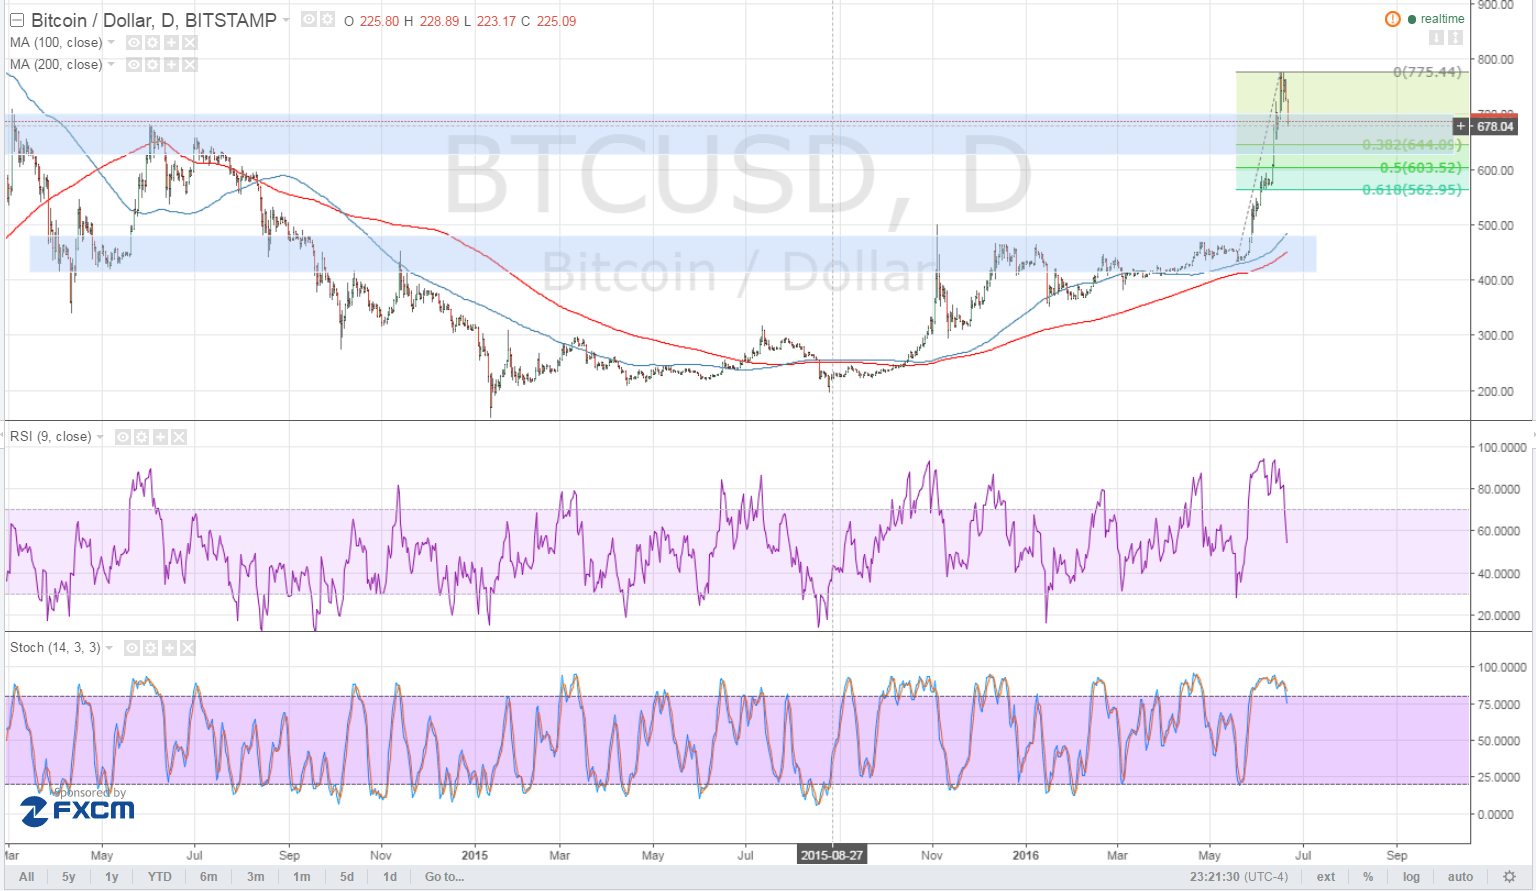
- Bitcoin appears to have hit a ceiling at the $775 mark, making a break below a short-term consolidation pattern and moving towards the nearby support.
- Price is now trading below the $700 mark and could head further south until $650, which is close to the 38.2% Fibonacci retracement level and a former resistance.
- A bounce off this correction area could allow bitcoin price to resume its climb to the recent highs and beyond.
Bitcoin price gave in to overbought conditions and is in the middle of a large correction to an area of interest.
Technical Indicators Signals
On the daily time frame, the 100 SMA is above the longer-term 200 SMA so the path of least resistance is to the upside. However, the gap between these moving averages is narrowing so bullish pressure might be weakening.
Stochastic is turning down from the overbought zone, which means that buyers are taking a break and allowing sellers to take over from here. RSI is also heading south so bitcoin price might follow suit. A larger correction could last until the 50-61.8% Fib levels, which are close to another area of interest at $600.
A break below these Fibs could spur a drop all the way down to the $450 area, highlighted in the lower blue box below. This is also near the moving averages, which might hold as dynamic support.

Market Events
The clock is ticking closer to the EU referendum, which means traders might be booking profits off their recent long bitcoin positions. After all, a vote to stay in the EU could lift the uncertainty off the financial markets, leading traders back to traditional assets such as stocks and away from virtual currencies.
Still, a vote to exit the EU could mean more gains for bitcoin price, as this could have significant repercussions on the global economy. Central banks have expressed their intention to step in if financial markets become too turbulent, discouraging investors from putting money in fiat currencies for now.
Apart from the EU referendum, another factor that could spur BTCUSD moves today is Fed Chairperson Yellen’s speech so keep an eye out for her remarks.
Charts from TradingView