Bitcoin Price Key Highlights
- Bitcoin price recently bounced off the new channel support and is indicating a return to bullish pressure.
- Price also moved past the area of interest highlighted in the previous article to show that buyers are regaining control.
- Bitcoin is still hanging around the mid-channel area of interest so there may be a bit of resistance before it is able to climb back to the top or the all-time highs.
Bitcoin price is showing a pickup in bullish momentum but technical indicators are giving mixed signals.
Technical Indicators Signals
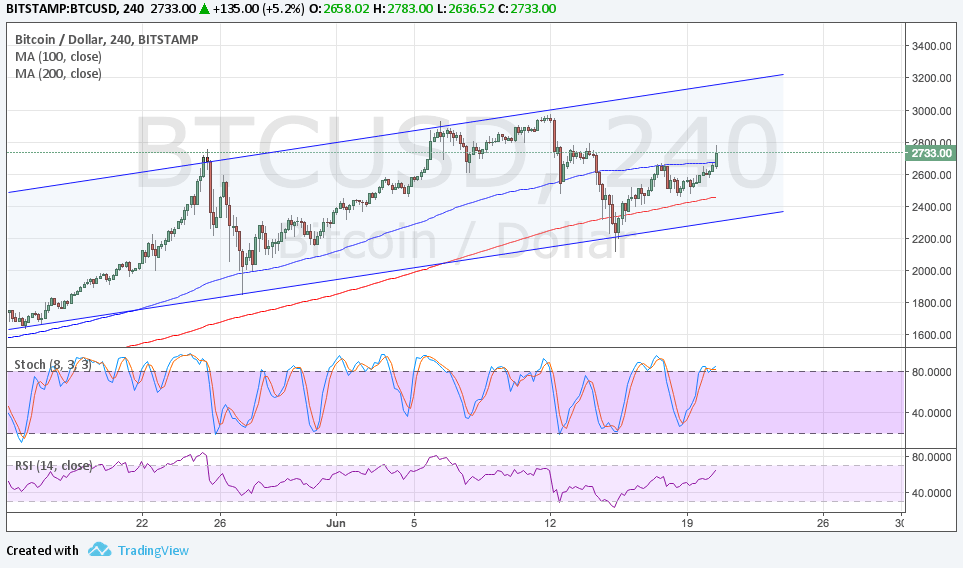
The 100 SMA is above the longer-term 200 SMA so the path of least resistance is to the upside. However, the gap between the moving averages is narrowing to reflect weakening buying momentum. If a downward crossover happens, bears could get back in the game and push for another test of support.
The 200 SMA is close to the channel support around $2400 so this might be the line in the sand for the uptrend. A break below this area could encourage more sellers to hop in or spur bulls to liquidate their holdings.
Stochastic is already dipping into the overbought territory to suggest that buyers are feeling exhausted. RSI is still on the move up so bitcoin price might follow suit while buying pressure is in play, but this oscillator is nearing overbought levels also. Once both turn lower, a dip in price action could be seen.

Market Factors
US equity indices are edging down once more as the tech sector has been unable to sustain its climb. In addition, a bleaker outlook for the crude oil market is starting to dampen risk appetite.
A pickup in risk aversion could shore up bitcoin price gains once more as traders typically search for higher returns in alternative markets like cryptocurrencies during these scenarios. Keep in mind that Brexit talks are going on so there’s also that extra degree of uncertainty in the European region.
Meanwhile, reports indicating that Bitcoin is about to be accepted as a legal form of payment in India revived speculations of higher volumes similar to the effect seen when the Japanese government made the announcement earlier this year.