Bitcoin Price Key Highlights
- Bitcoin price recently bounced off resistance near the $2800 mark and may be pulling back from a short-term climb.
- Price is moving inside a small ascending channel visible on the 1-hour time frame and could test support soon.
- Technical indicators suggest that the correction could be in play for some time but that the overall uptrend could stay intact.
Bitcoin price seems to be making a quick correction from its current climb and could find support at the ascending channel.
Technical Indicators Signals
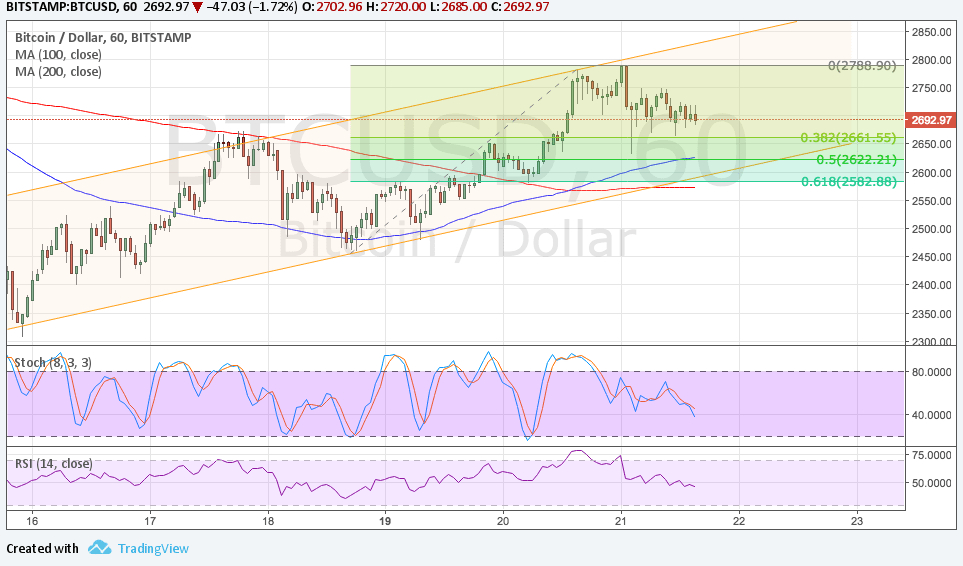
The 100 SMA is above the longer-term 200 SMA on the 1-hour chart so the path of least resistance is to the upside. This means that the uptrend is more likely to resume than to reverse.
Applying the Fib tool on the latest swing low and high shows that the 50% retracement level lines up with support around $2600. The 100 SMA coincides with this level while the 200 SMA is closer to the 61.8% Fib, which might also keep losses in check. The 50% Fib lines up with a former resistance level as well.
Stochastic is still heading south, though, so bitcoin price might follow suit. RSI is also on the move down to suggest that sellers are still in control of price action. However, both oscillators are approaching oversold conditions, which could spur profit-taking among bears and lead to a bounce.

Market Factors
The US dollar managed to chalk up some gains against its rivals as a bit of risk aversion crept in the markets while commodities tumbled. However, a couple of Fed officials hinted that they might start unwinding their balance sheet in September, which meant that a rate hike could be delayed to December at the earliest. If confirmed, this could lead to dollar weakness on doubts that the Fed can sustain its plan to hike three times this year.
Meanwhile, news that India has formed a committee to look into virtual currencies is encouraging startups and investors in the country in hopes that regulation could boost the legitimacy of Bitcoin and therefore its value.