Bitcoin Price Key Highlights
- Bitcoin price has consolidated after its strong rally and correction in the past month.
- But with the end of the month AND quarter upon us, there’s a strong chance that traders would book profits off their recent positions.
- At the moment, bitcoin price appears to be showing a bearish flag pattern, which is typically considered a selloff continuation signal.
Bitcoin price could be in for another round of volatile action at the end of this month and quarter.
Technical Indicators Signals
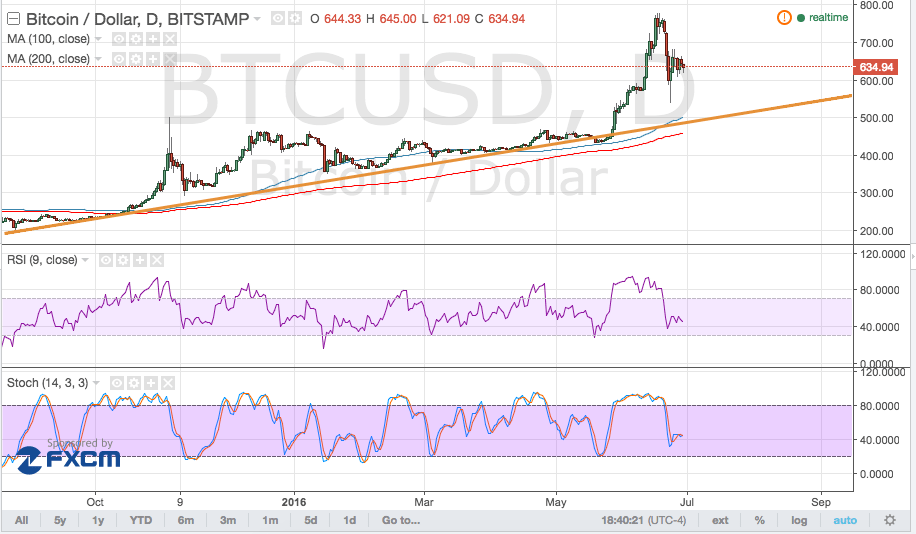
On the daily time frame, it can be seen that bitcoin price is still in the middle of a pullback from its recent rally. The 100 SMA is above the 200 SMA so the path of least resistance is to the upside, which suggests that bitcoin could have a shot at testing its previous highs just below the $800 mark or heading much further north.
However, a much larger pullback could be possible, as a bearish flag has formed. A candle closing below the $600 mark could be enough to confirm that sellers are regaining control, although bitcoin price could still draw support from the daily rising trend line which lines up with the 100 SMA dynamic inflection point.
RSI is still pointing down, which means that bearish pressure is present. Similarly stochastic is heading south so bitcoin price might follow suit. If so, price could head until the area of interest at $500-550, which would be the line in the sand for any uptrend correction.

Market Events
Traders appear to be keeping their hopes up for a positive EU-UK deal in the post-Brexit world, as risk appetite has returned to financial markets. Investors are putting funds back in in equities and currencies, leading to gains across the board.
However, profit-taking activity by both retail and institutional investors usually around the end of the month and quarter could bring extra volatility to the mix. Traders might be keen to pocket their gains off the recent market events for now and start fresh for the second half of the year, which has several other top-tier events lined up.
Charts from TradingView