Bitcoin Price Key Highlights
- Bitcoin price has pulled up from its dive recently but might be done with its correction.
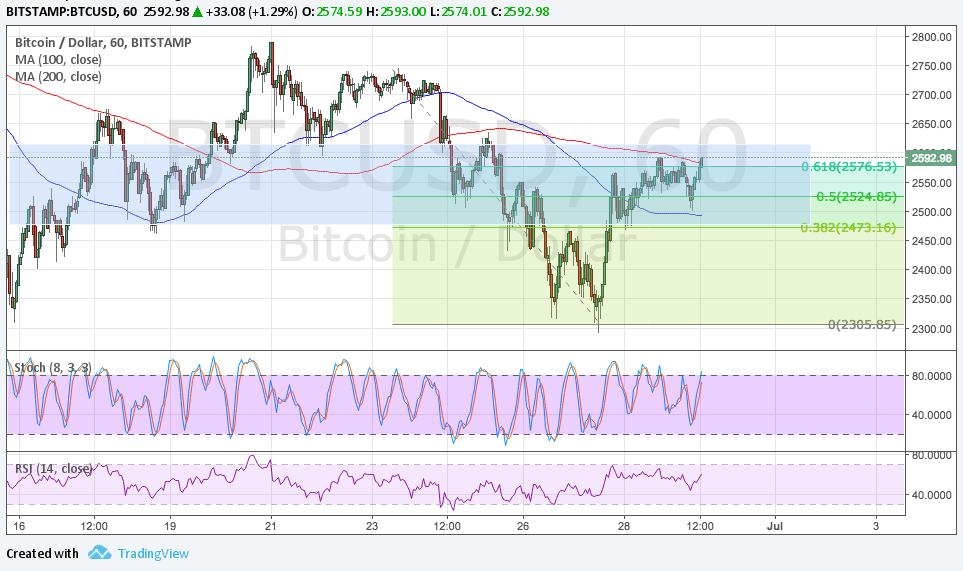
- Price is hitting a ceiling at the 61.8% Fibonacci retracement level, which lines up with a broken support zone.
- If sellers return, bitcoin price could resume its drop to the swing low near $2300.
Bitcoin price is in the middle of a correction but already seems to be hitting a ceiling at $2600.
Technical Indicators Signals
The 100 SMA is below the longer-term 200 SMA in this time frame so the path of least resistance is still to the downside. Also, the gap between the moving averages is widening to reflect stronger selling pressure. The 200 SMA coincides with the 61.8% Fib to add to its strength as resistance as well.
Stochastic is still on the move up to suggest that there’s some buying pressure left. In that case, a break past the area of interest could be possible, taking bitcoin price up to the next ceiling around $2700-2750. A sustained move past this area could lead to a test of the record highs.
RSI has been on the move down but appears to be pulling up once more so bitcoin price might follow suit. But if stronger selling pressure kicks in, the price could break past the swing low and go to the next floor at $2000.

Market Factors
There has been a strong recovery among cryptocurrencies in the past few days but it looks like consolidation is still in play. Stronger volatility could be seen as the summer months are starting as low liquidity could mean big price moves even from smaller positions.
The US dollar seems to be in a weaker spot against its peers as traders continue to doubt that the Trump administration could push its reform agenda before the end of the year. Apart from that, the pickup in risk appetite as central bankers switch to a more hawkish tone has benefitted other assets like stocks and commodities.
The lack of major industry updates could leave bitcoin traders on edge, though, so stay on the lookout for any big headlines right around the start of the new quarter.