Bitcoin Price Key Highlights
- Bitcoin price recently sold off but found support around the $650 area as predicted in an earlier article.
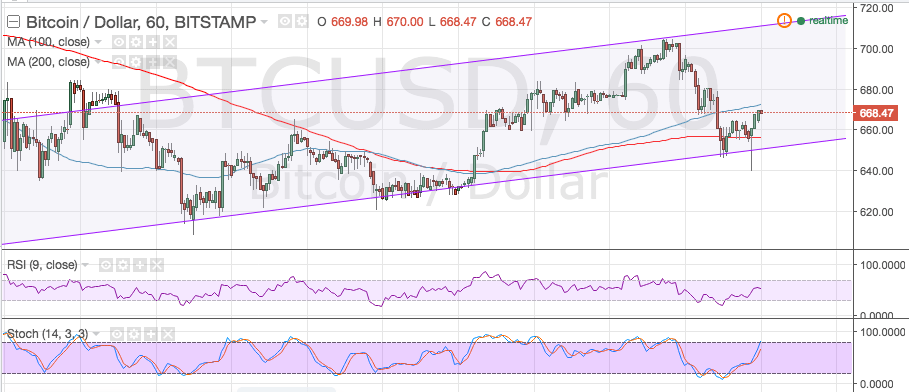
- This was in line with the 200 SMA, which held as a dynamic support level.
- Bullish pressure seems to be building up again as an ascending channel is forming.
Bitcoin price could be due for a test of the ascending channel resistance visible on its 1-hour time frame.
Technical Indicators Signals
Bitcoin price made a quick spike on its test of the channel support, indicating that buyers are putting up a fight and ready to push price back up to the top of the range. The 100 SMA is above the 200 SMA, confirming that the path of least resistance is to the upside, and the gap between the moving averages is widening so bullish momentum is getting stronger.
In that case, price could have enough energy to climb to the top of the channel around the $720 level. Stochastic is on the move up, also suggesting that buyers are taking control. However, once the oscillator reaches the overbought area and turns down, sellers could regain the upper hand, possibly triggering another test of channel support around $660 this time.
RSI is on middle ground, barely offering any strong directional clues. Bitcoin price is nearing the mid-channel area of interest at $680, at which some profit-taking orders might be located.

Market Events
Most of the market events have passed but the start of the second half of the year is also lined up with a number of top-tier announcements, particularly from the major central banks. This week, the RBA decision is due and an easing announcement could bring more demand for non-fiat currencies like bitcoin.
Also lined up this week is the release of the FOMC minutes, which should shed more light on when the Fed might hike rates next. This could show more confirmation that the US central bank would sit on its hands now that the UK has decided to exit the EU, bringing more uncertainty to the global economy. Later on in the week, the NFP release could also have a strong impact on bitcoin price action against the dollar.
Charts from TradingView