Bitcoin Price Key Highlights
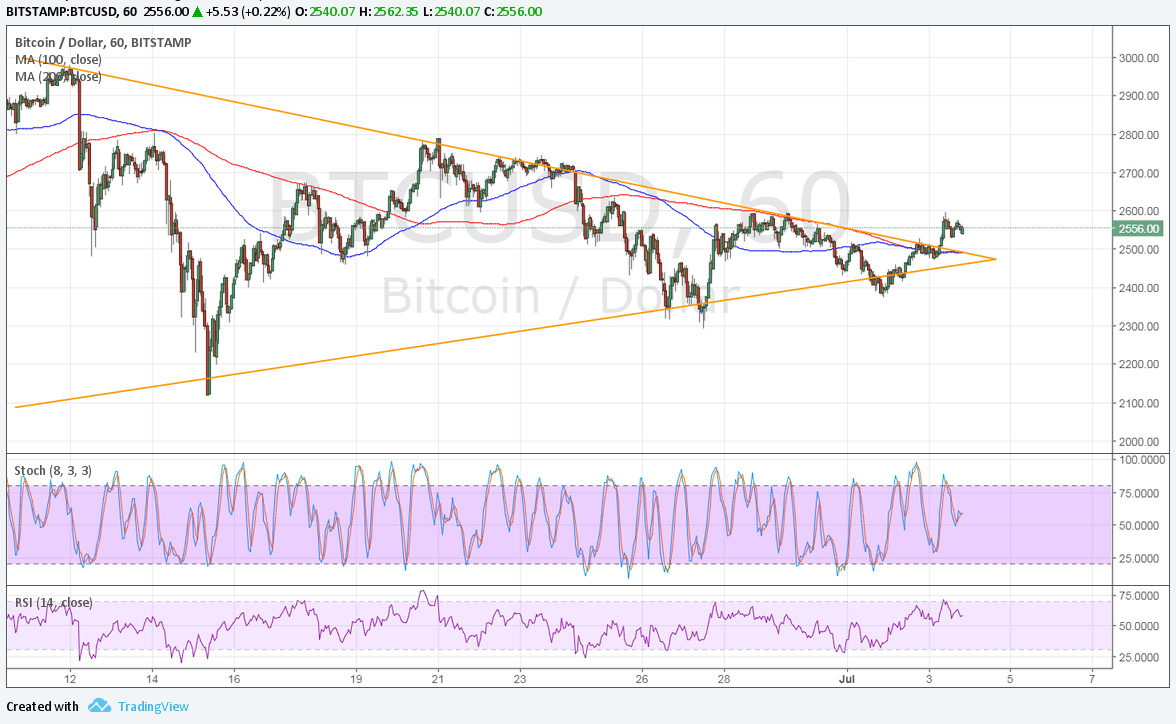
- Bitcoin price recently consolidated in a tight symmetrical triangle pattern on its 1-hour chart.
- Price has just broken to the upside to reflect a pickup in buying momentum.
- The chart pattern spans $2100 to around $2900 so the resulting rally could last by around $800.
Bitcoin price made an upside break from its triangle consolidation pattern to show that bulls are getting the upper hand.
Technical Indicators Signals
The 100 SMA is still moving close to the 200 SMA and has yet to complete an upward crossover to confirm that buying momentum is kicking into high gear. However, the moving averages line up with the broken triangle resistance and could act as support from here.
Bitcoin price could make a quick retest of the triangle resistance around $2500 before carrying on with its climb, possibly making a test of the nearby ceiling at $2700 then at $2900. Stronger buying pressure could lead to a test of the all-time highs or perhaps the creation of new ones.
However, stochastic is still on the move down to indicate that bears have control for now. RSI is also pointing down so bitcoin price might take its cue and head back south. If the breakout proves to be a fake out, bears could take advantage and push for larger losses.

Market Factors
The US dollar has actually strengthened against its peers recently on stronger than expected ISM manufacturing PMI. This could signal an upside surprise for the June NFP release, which might boost Fed rate hike prospects for September. On the other hand, a disappointing NFP report could lead to more dollar weakness.
Bullish remarks from Goldman Sachs indicating that bitcoin price might climb an additional 50% revived the cryptocurrency, which has actually been bogged down by remarks from the same firm warning of a large potential selloff. Sheba Jafari noted that bitcoin could be in its fifth wave of gains, which might mean tremendous upside all the way up to $3915.
“From current levels, this has a minimum target that goes out to 3,212 (if equal to the length of wave I),” Jafari wrote. “There’s potential to extend as far as 3,915 (if 1.618 times the length of wave I). It just might take time to get there.”