Bitcoin Price Key Highlights
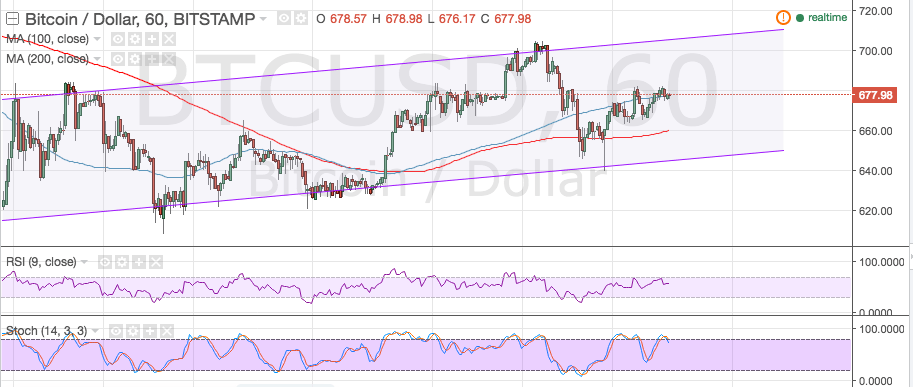
- Bitcoin price continues to trend higher, still inside its ascending channel pattern visible on the 1hour time frame.
- However, price seems to be stalling at an area of interest around the middle of the channel.
- If this holds as resistance, bitcoin price could be in for another test of support around $650.
Bitcoin price could be in for more volatility today as US traders return from their Fourth of July holiday.
Technical Indicators Signals
The 100 SMA is still above the 200 SMA so the path of least resistance is to the upside. The 100 SMA lines up with the middle of the channel and is currently holding as a dynamic inflection point. Once bitcoin price breaks past this near-term resistance around $680, it could get back on track towards testing the channel resistance around $700-710.
RSI hasn’t quite reached the overbought zone but it already seems to be turning lower, indicating that sellers are taking control of price action. Stochastic is slightly in the overbought zone already, which means that buying pressure is already exhausted.
If selling pressure gets strong enough, a downside break of the channel support might even take place, pushing bitcoin price to the next area of interest around $620.

Market Events
The return of US traders from their long weekend could inspire more volatility for bitcoin price action today, as investors might re-establish their long positions for the second half of the year. After all, a significant amount of uncertainty is left in the financial markets as UK and EU officials figure out what to do in a Brexit.
Aside from that, data from China has been mostly weaker than expected, which could prompt more investors to move funds into cryptocurrencies and out of the Chinese stock markets. Yuan weakness is also expected, along with potential capital controls that could lead traders to seek alternative investments.
Central bank announcements are also scheduled for this week and the next, likely influencing overall market sentiment. Easing policies could lead to declines for fiat currencies, also supporting demand for bitcoin and other assets that are not affected by monetary policy changes.
Charts from TradingView