Bitcoin Price Key Highlights
- Bitcoin price is forming a new triangle on its 1-hour time frame, reflecting hesitation among bulls and bears.
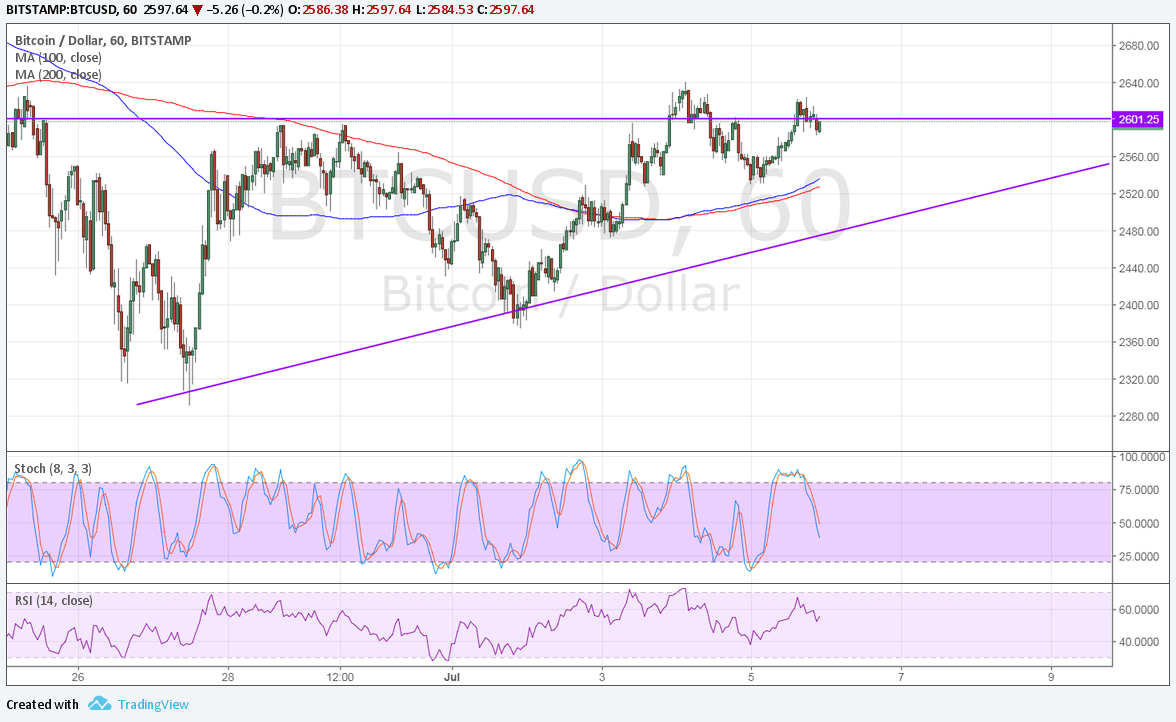
- Price has formed higher lows and found resistance at $2600, creating an ascending triangle pattern.
- Price is currently testing the resistance and could be due for another move back to support around $2500.
Bitcoin price is consolidating in an ascending triangle pattern on its 1-hour chart, still deciding whether to bounce or break from resistance.
Technical Indicators Signals
The 100 SMA is slightly above the longer-term 200 SMA to signal that the path of least resistance is to the upside. This means that a break higher could be possible if bullish momentum gets stronger.
However, stochastic is heading south so bitcoin price might follow suit. RSI is also moving lower to reflect a pickup in selling pressure, likely enough to lead to a dip to support around $2550 near the moving averages dynamic inflection points.
Note that the chart pattern spans $2300 to $2600 so the resulting breakout could lead to either a rally of $300 or a selloff of $300. But if support refuses to give way, another bounce back to the resistance could be due.

Market Factors
The FOMC minutes revealed that policymakers are still torn when it comes to starting their balance sheet reinvestment operations in a few months or waiting until later in the year. The report also revealed that some officials are starting to worry about weakening price pressures, citing that the improvements in the labor market might not be enough to boost inflation to their 2% target.
The NFP report is still up for release and this might provide more context to Fed policy expectations. The ISM manufacturing PMI indicated a strong jump in its jobs component for June so traders are hoping for an upside surprise which could shore up September rate hike prospects.
The ADP report and ISM non-manufacturing PMI are still lined up for today and disappointments might temper upbeat forecasts. Analysts are expecting to see a 175K rise in employment for June.