Bitcoin Price Key Highlights
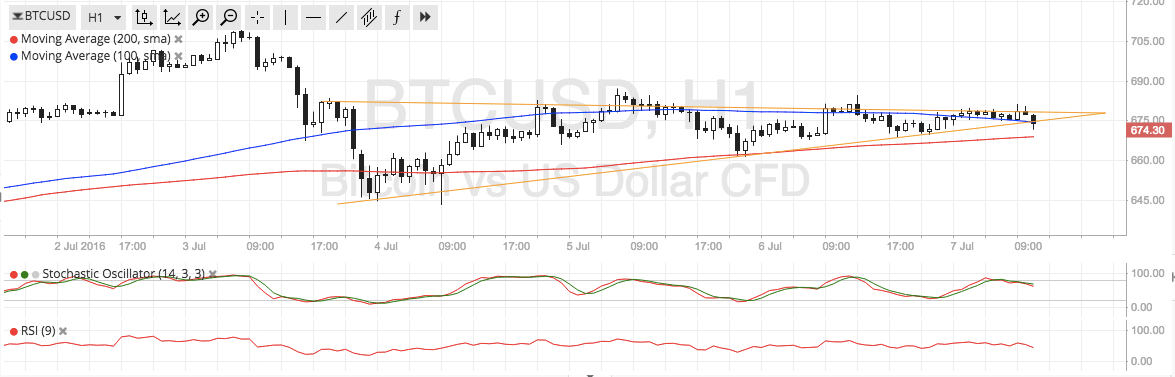
- Bitcoin price recently formed higher lows and lower highs, creating a symmetrical triangle formation on the 1-hour time frame.
- Price appears ready to make a downside break, perhaps indicating that further losses are in the cards.
- The short-term consolidation pattern looks like a bearish flag when viewed from the longer-term time frames.
Bitcoin price could be due for more losses if it breaks below the support of this symmetrical triangle pattern.
Technical Indicators Signals
The 100 SMA is above the 200 SMA for now so the path of least resistance may be to the upside. However, the gap between the moving averages is narrowing so a downward crossover might take place, indicating that sellers are taking control of bitcoin price action.
In that case, price could drop to the next area of interest at $650-660. Stochastic is turning lower from the overbought region to show a buildup in selling momentum while RSI is also heading south as well, with bitcoin price likely to follow suit.
For now, the 200 SMA could still hold as near-term support, but that would hinge on how the upcoming market catalysts turn out. Uncertainty in the European region following the Brexit seems to have subsided, although this consolidation could also be indicative that a strong breakout is brewing.

Market Events
Remaining major event risks for the week include the NFP report, which might yield more gains for the dollar across the board if the actual reading comes in stronger than expected. Analysts are expecting to see a 174K increase in employment, much stronger than the previous month’s 38K rise, although revisions to earlier reports are also likely.
Stronger than expected jobs data could mean more gains for the dollar as it would revive rate hike expectations for the year. The FOMC minutes revealed that policymakers already had a neutral bias leading up to the EU referendum mostly because of the disappointing May NFP figures.
Still, global economic risks are very much present and continue to prop up demand for alternative assets like bitcoin and other cryptocurrencies. China has also proven to be a potential risk, which could keep investors flocking to bitcoin.
Charts from SimpleFX