Bitcoin Price Key Highlights
- Bitcoin price recently made a selloff but it has since pulled up from this dive.
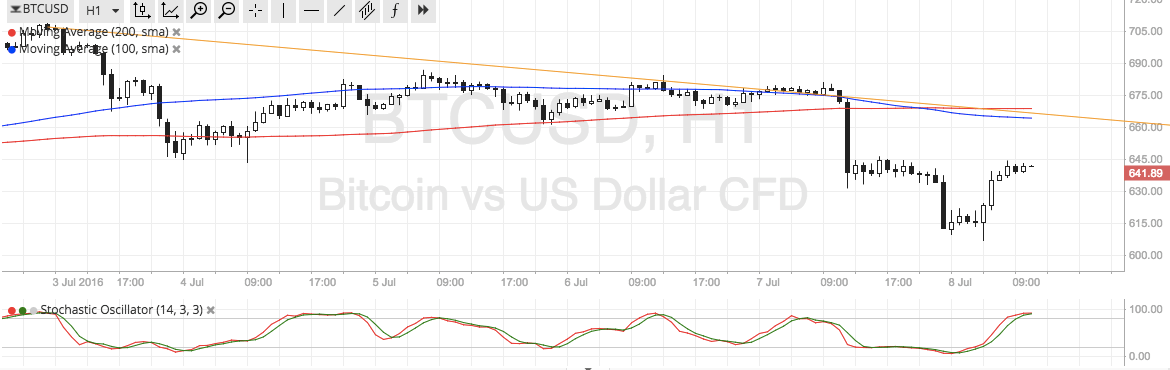
- A descending trend line can be drawn to connect the recent highs of price action on the 1-hour time frame since the start of this month.
- Price could pull up to this trend line before the selloff resumes.
Bitcoin price appears to be making a correction from its downtrend, with several inflection points lined up around $660.
Technical Indicators Signals
Bitcoin price is currently stalling at an area of interest at $645, which previously held as support and is now holding as a ceiling. This also coincides with the 50% Fibonacci retracement level on the latest swing high and low.
The 100 SMA just crossed below the 200 SMA to indicate that sellers are taking control. In addition, these moving averages line up with the falling trend line, adding to its strength as potential resistance.
If the $660 area does keep gains in check, bitcoin price could resume its drop to the lows around $615 or onto new lows closer to $600. Stochastic is nearing the overbought zone, which means that buying pressure is weakening and that selling momentum could be seen later on.

Market Events
The main catalyst for bitcoin price action to the US dollar today might be the US non-farm payrolls report. Analysts are expecting to see a 175K increase in employment, a huge improvement over the previous month’s 38K gain. Also, positive revisions to earlier reports are eyed, adding to the total of jobs gains for June. However, the unemployment rate is expected to tick higher from 4.7% to 4.8%.
Leading jobs indicators such as the ADP report and the ISM surveys have all hinted at stronger hiring gains so there should be a good chance for an upside surprise. Even so, a strong reading might not be enough to convince market watchers that the Fed would hike interest rates soon, as policymakers are still figuring out how to adjust to a Brexit.
In any case, bitcoin price could also draw a bit of support from Chinese yuan devaluation since this convinces investors to move their funds out of local markets and onto alternative investments like bitcoin.
Charts from SimpleFX