Bitcoin Price Key Highlights
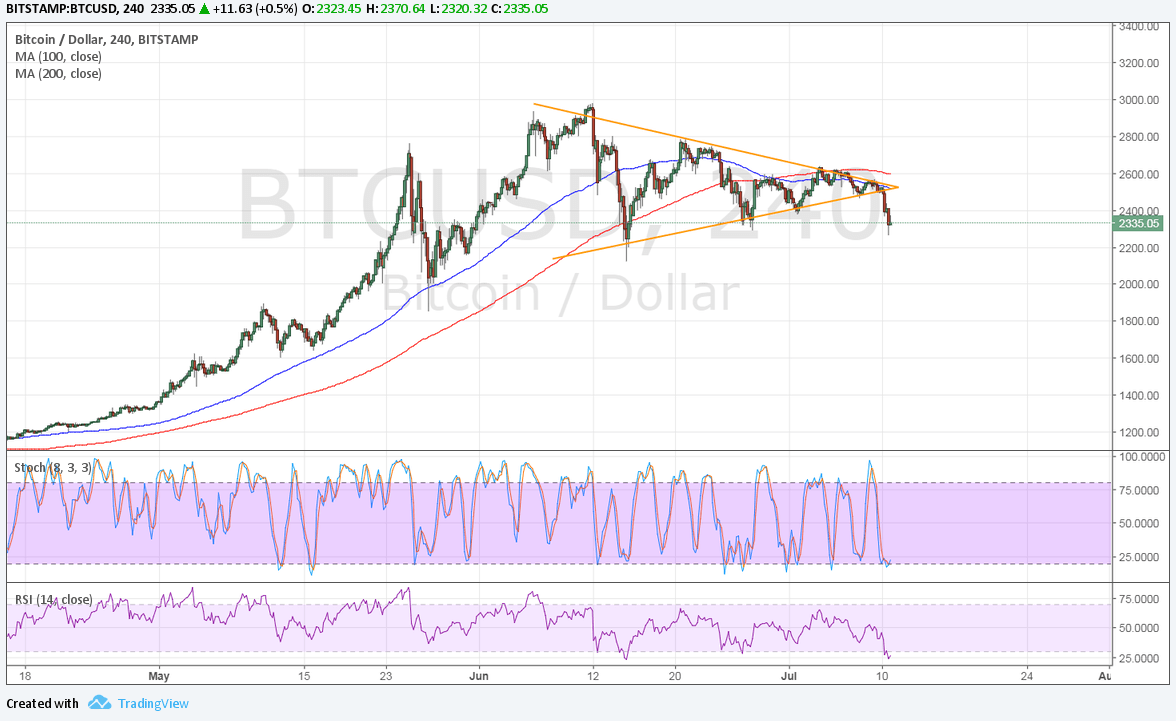
- Bitcoin price was previously stuck in a symmetrical triangle consolidation pattern as bulls and bears have been battling it out.
- Price finally picked a direction and broke lower, signaling that sellers have gained the upper hand.
- This also allows bitcoin price to complete its complex head and shoulders formation, which is a classic downtrend signal.
Bitcoin price made a downside break from its triangle consolidation pattern to confirm that sellers are taking control from here.
Technical Indicators Signals
The 100 SMA has also crossed below the longer-term 200 SMA to indicate that the path of least resistance is to the downside. These moving averages have also been in line with the top of the triangle, adding to its strength as a ceiling.
The chart pattern is approximate $800 tall so the resulting selloff could be of the same size, taking bitcoin price down to $1700 next. However, both stochastic and RSI are at oversold levels, so profit-taking could happen once the oscillators pull up.
Bitcoin could pull back to the broken triangle support around $2500 before heading further south. But if this breakout proves to be a fake out, the price could still recover back above the triangle resistance to retest the all-time highs.

Market Factors
Dollar strength came into play after Friday’s NFP report printed stronger than expected headline figures for June. To top it off, the May report also enjoyed an upgrade, similar to the Fed labor market conditions index.
This solidified Fed tightening expectations for September and also sets the stage for upbeat remarks from central bank head Yellen later on this week. If so, dollar demand could ramp up once more and put more weight on bitcoin price.
Concerns about the fork are dragging bitcoin lower once more as investors are looking closer into a soft fork vs. hard fork scenario, with the former entailing minor revisions to code and the latter involving an actual split that might complicate transactions and holdings with exchanges.
SaveSave
SaveSave
SaveSave