Bitcoin Price Technical Analysis
- Bitcoin price is still stuck in its consolidation pattern visible on the 4-hour time frame.
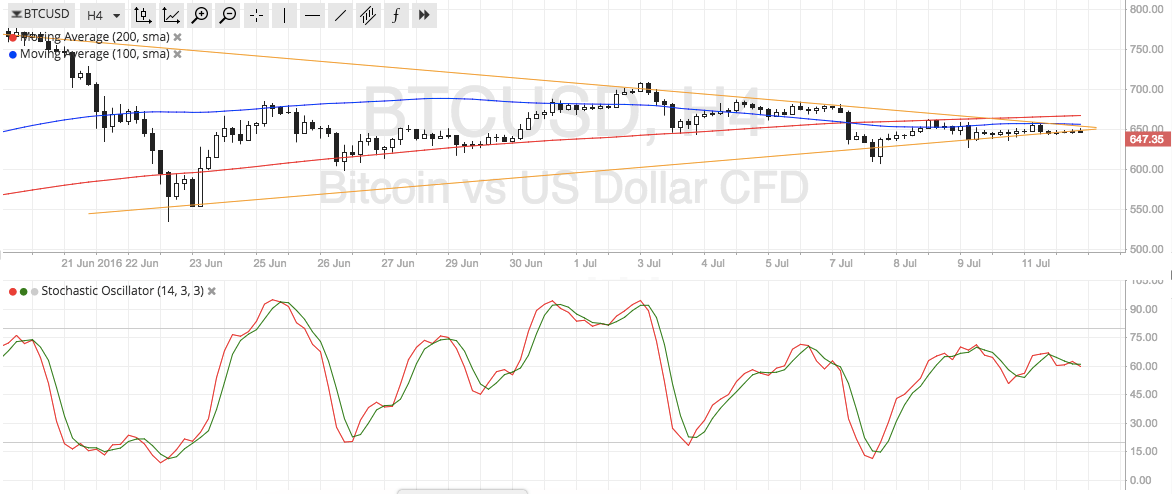
- Price is already at the peak of the symmetrical triangle formation, which means that a breakout could take place anytime now.
- Technical indicators and market sentiment appear to be hinting at a downside break.
Bitcoin price could be due for a strong break out of its consolidation pattern, but traders still seem to be undecided which way to push.
Technical Indicators Signals
The 100 SMA is below the 200 SMA so the path of least resistance is to the downside. A candle close below the $640 level could be enough to confirm a break lower, triggering a longer-term drop to the triangle bottom near $550. On the other hand, a long green candle closing above $650 could signify an upside breakout and start a climb to the triangle top at $775.
Stochastic hasn’t quite reached the overbought region yet but appears to be turning lower, indicating a return in selling pressure. In that case, bears could push for a breakdown of triangle support if selling momentum keeps up.
For now, moving averages also appear to be oscillating so range-bound conditions could persist. These moving averages might also hold as dynamic resistance areas as well.

Market Events
The new PM leadership of Theresa May has lifted a bit of uncertainty off the European markets, as the UK can move on to Brexit negotiations. This could restore activity in equity and currency markets, driving investors away from bitcoin for the time being.
Still, there’s still a lot of economic uncertainty in the region and the talks between UK and EU officials could still keep traders on edge. In addition, the upcoming economic releases from China should provide more clues on how the world’s second largest economy is faring.
Keep in mind that the weakness in Chinese data over the past few months has spurred bitcoin price rallies as investors move away from local stock markets and yuan holdings. Chinese GDP is expected to slow from 6.9% to 6.8% in Q2 while industrial production, fixed asset investment, and retail sales could also weaken.
Charts from SimpleFX