Bitcoin Price Key Highlights
- Bitcoin price is in selloff mode but could be due for a pullback to nearby resistance levels.
- A small double bottom pattern can be seen on the short-term time frames, signaling bearish exhaustion and potential profit-taking.
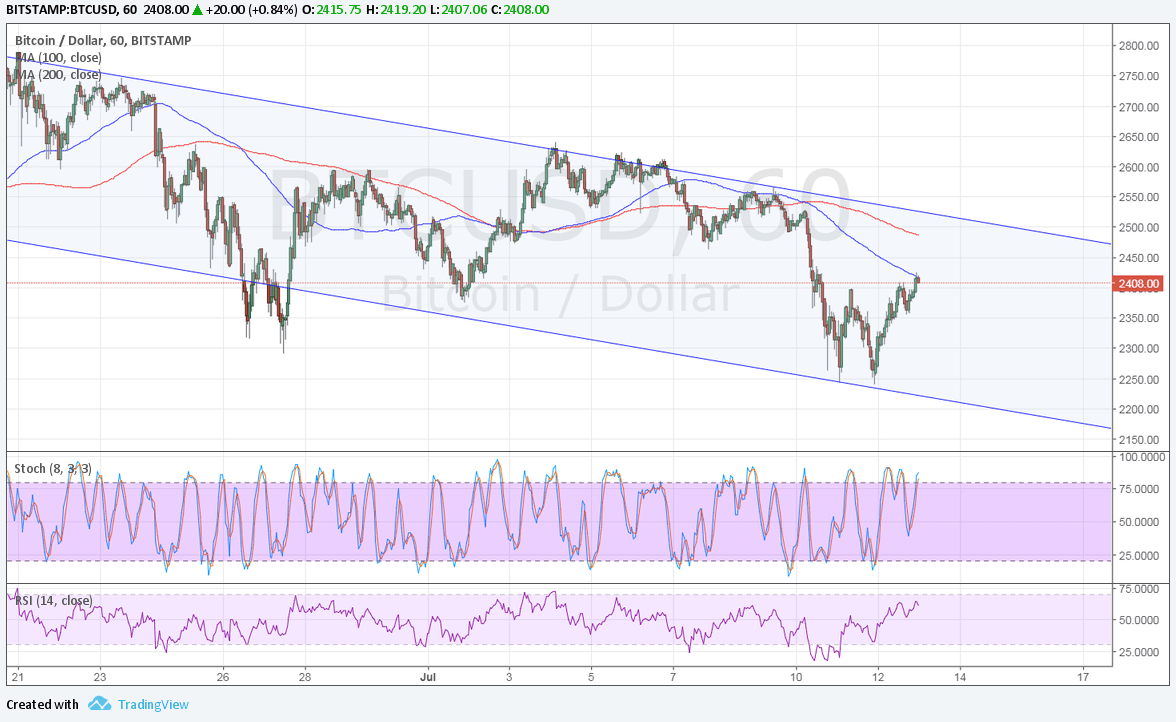
- Price is also moving inside a descending channel pattern on its 1-hour chart and has just bounced off support.
Bitcoin price could be due for a correction to the descending channel resistance before heading further south.
Technical Indicators Signals
The 100 SMA is below the longer-term 200 SMA so the path of least resistance is to the downside. The gap between the two moving averages is widening to reflect stronger bearish pressure and the 100 SMA is holding as dynamic resistance at the moment. The 200 SMA is closer to the channel resistance at $2500 and also a former support zone.
Stochastic is pointing up to signal that buyers still have enough energy to push for some gains. RSI is also on the move up so bitcoin price might follow suit. However, both oscillators are nearing overbought levels and turning lower could draw sellers back in the mix.
Note that the double bottom spans $2250-$2400 so the resulting rally could be of the same size, just enough to take bitcoin price for a test of the resistance around $2500-2550.

Market Factors
Dollar demand weakened once more as Fed Chairperson Yellen was less upbeat than expected. Many hoped that she would highlight the recent NFP report but she delivered a balanced statement and signaled that inflation remains a concern.
Meanwhile, bitcoin is still trying to recover from the recent sharp selloff as market confidence in the cryptocurrency market seems to have taken a hit. The focus has returned to hard fork issues and to speculations of a bubble, especially since another batch of analysts have downplayed its potential as a legitimate store of value.
A team of analysts from Morgan Stanley led by James Faucette mentioned that bitcoin is a poster child for speculation.
“The ecosystem has focused more on value speculation rather than the foot-leather-eating work of increasing acceptance — way easier to trade speculatively than convince new merchants to accept the cryptocurrency,” said Faucette.