Bitcoin Price Key Highlights
- Bitcoin price underwent additional volatility and sold off yesterday but it appears to be testing another support area.
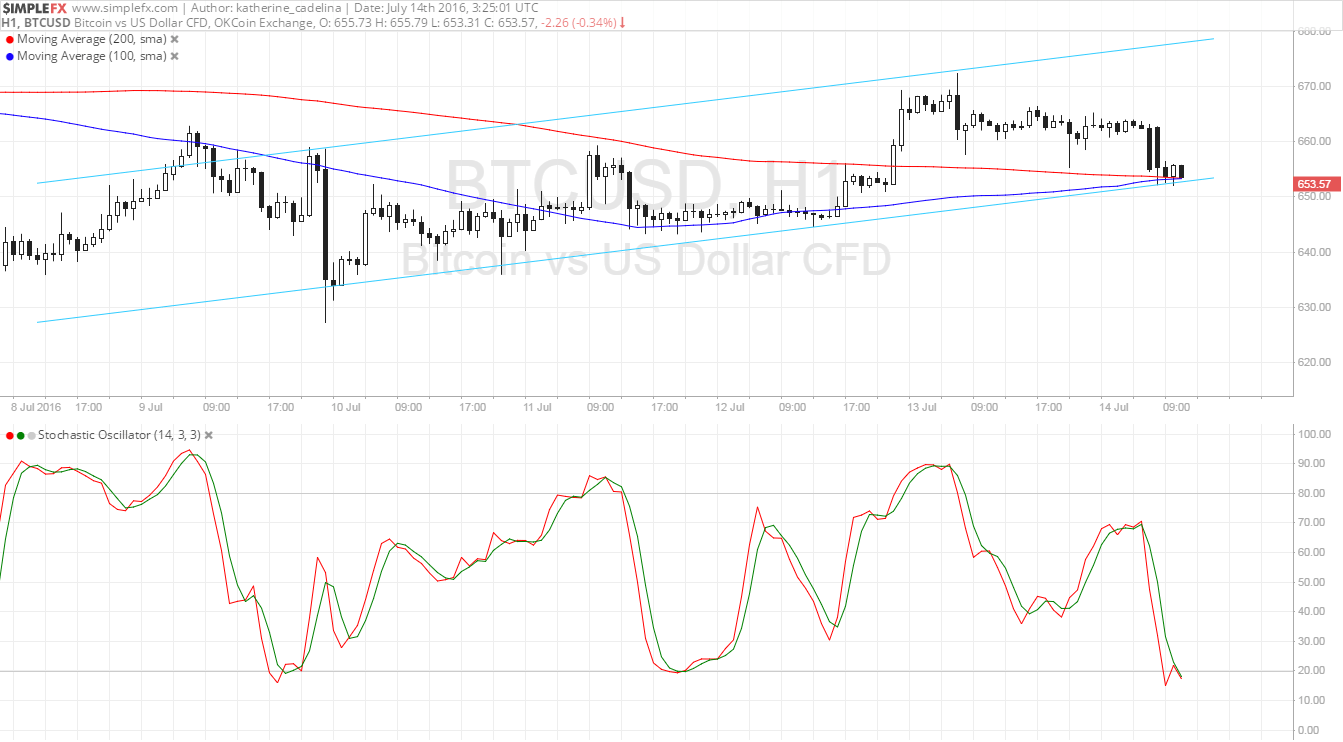
- Price is forming an ascending channel pattern on its 1-hour time frame and might be due for a bounce towards the resistance.
- Technical indicators are also suggesting that buyers could regain control.
Bitcoin price could be due for a bounce off this support zone and technical indicators appear to be in agreement.
Technical Indicators Signals
The 100 SMA is crossing above the longer-term 200 SMA to confirm that the uptrend could carry on. In addition, the moving averages line up with the channel support, adding to its strength as a floor. If a bounce takes place, bitcoin price could head up to the top of the channel around $680.
Stochastic is nearing the oversold zone to show that sellers are getting exhausted and that buyers might take over. The oscillator has yet to turn higher to show a return in bullish pressure.
However, if sellers refuse to let up, a break below the channel support could ensue and push bitcoin price on a prolonged drop, possibly until the area of interest at $640 then onto the major psychological support at $600.

Market Events
Bitcoin price enjoyed additional volatility right around the end of the US session yesterday, as traders probably booked profits ahead of today’s Bank of England monetary policy statement. Analysts are still divided on a potential interest rate cut, as some believe that the U.K. central bank could hold its fire until next month or act pre-emptively to prevent a worse contraction in the economy.
Other potential catalysts for bitcoin price action include the top-tier data releases from China in Friday’s Asian trading session. GDP, industrial production, retail sales, and fixed asset investment are all expected to show weaker activity and might spook investors to move funds back to bitcoin. After all, economic weakness could lead to yuan devaluation and possibly capital controls from the government.
Keep in mind that this behavior was one of the primary factors for the bitcoin price rally in late May and early June, as uncertainty and fears of a global economic slowdown have boosted demand for alternative assets like bitcoin.
Charts from SimpleFX