
Bitcoin Price Key Highlights
- Bitcoin price recently broke below support of the descending triangle pattern on its 4-hour chart.
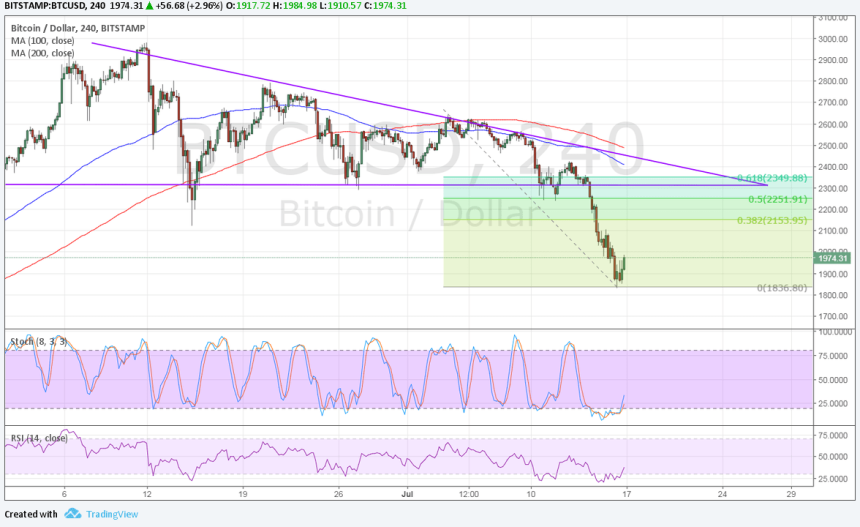
- Price found support around $1850 and could be due for a pullback before heading further south.
- Applying the Fibonacci retracement tool shows potential resistance levels.
Bitcoin price could be due for a correction from its breakdown move so that more sellers could allow the downtrend to continue.
Technical Indicators Signals
The 100 SMA is below the longer-term 200 SMA so the path of least resistance is to the downside. In addition, the moving averages are close to the descending triangle resistance, adding an extra layer of defense in the event of a larger correction.
The broken triangle support is in between the 50% and 61.8% Fibonacci retracement levels at $2251.91 and $2349.88 respectively. Stochastic is pulling up from the oversold area to signal a pickup in buying pressure while RSI looks ready to head north as well, so bitcoin price might follow suit.
If any of the Fibs keep gains in check, bitcoin could resume its drop to the previous lows or much lower. On the other hand, a break past the triangle resistance or moving averages could signal a return in bullish momentum.


Market Factors
US economic data turned out weaker than expected on Friday, dampening rate hike expectations for September and December once more. Headline CPI showed a flat reading instead of the estimated 0.1% increase while the core figure printed a meager 0.1% uptick instead of the projected 0.2% gain.
These undermine the Fed’s view that the slowdown in inflation was just temporary. Instead, weaker price pressures could force the central bank to rethink its tightening time line, along with balance sheet unwinding.
As for bitcoin price, speculations of further weakness and liquidation of positions after the recent slide led to a steeper drop over the weekend. Experts blamed this on several factors such as fears about the potential hard fork and larger firms dumping their cryptocurrency holdings as well.