Bitcoin Price Key Highlights
- Bitcoin price has been trading inside an ascending channel since the start of the month.
- Price made a strong bounce off the channel support on Friday on heightened risk aversion, triggering a climb to the top.
- If the channel resistance holds, another test of support could be in the cards.
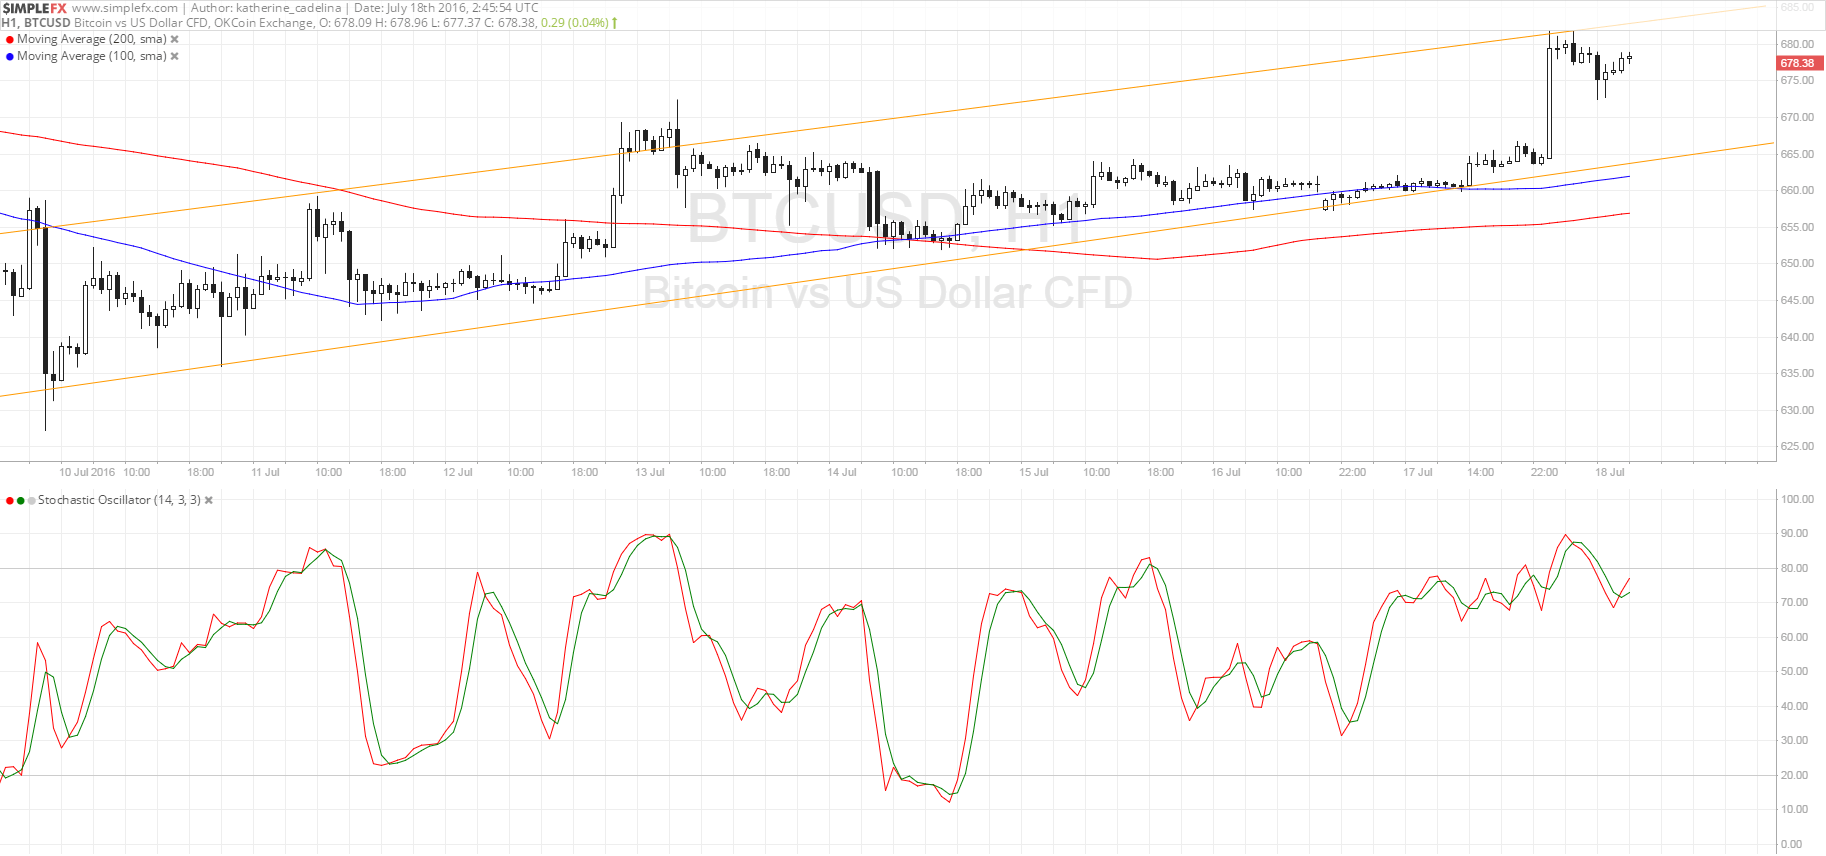
Bitcoin price appears to be encountering resistance at the top of the ascending channel visible on the 1-hour time frame.
Technical Indicators Signals
The 100 SMA is still above the longer-term 200 SMA, confirming that the path of least resistance is to the upside and that the uptrend could carry on. If you’re bullish on bitcoin price, better wait for an actual test of support at $665 near the 100 SMA if you’re planning on catching the uptrend.
Stochastic is pointing up but is in the middle of heading south from the overbought zone. This signals that sellers may be taking control of bitcoin price action for now or that profit-taking is in play. If bearish pressure becomes too strong, a downside break of support could take place and bring price down to the 200 SMA dynamic inflection point, which is close to the next area of interest at $650.

Market Events
Data from China came in mostly stronger than expected, easing fears of a slowdown in the world’s second largest economy and keeping a lid on bitcoin price gains earlier on Friday. However, the attack in Nice, France and the military coup in Turkey later that day sparked uncertainty in the financial markets once more.
This led to a pop higher in bitcoin price towards the end of Friday’s London session, followed by a bit of selling when the US printed stronger than expected consumer spending data. Headline retail sales rose 0.6% versus the projected 0.1% uptick while core retail sales increased 0.7% versus the estimated 0.4% rise.
For now, demand for the dollar could resume and bring bitcoin price back to the channel support. Prolonged uncertainty and additional geopolitical tension could keep traders cautious and on the hunt for stronger returns on alternative assets like bitcoin.
Charts from SimpleFX