Bitcoin Price Key Highlights
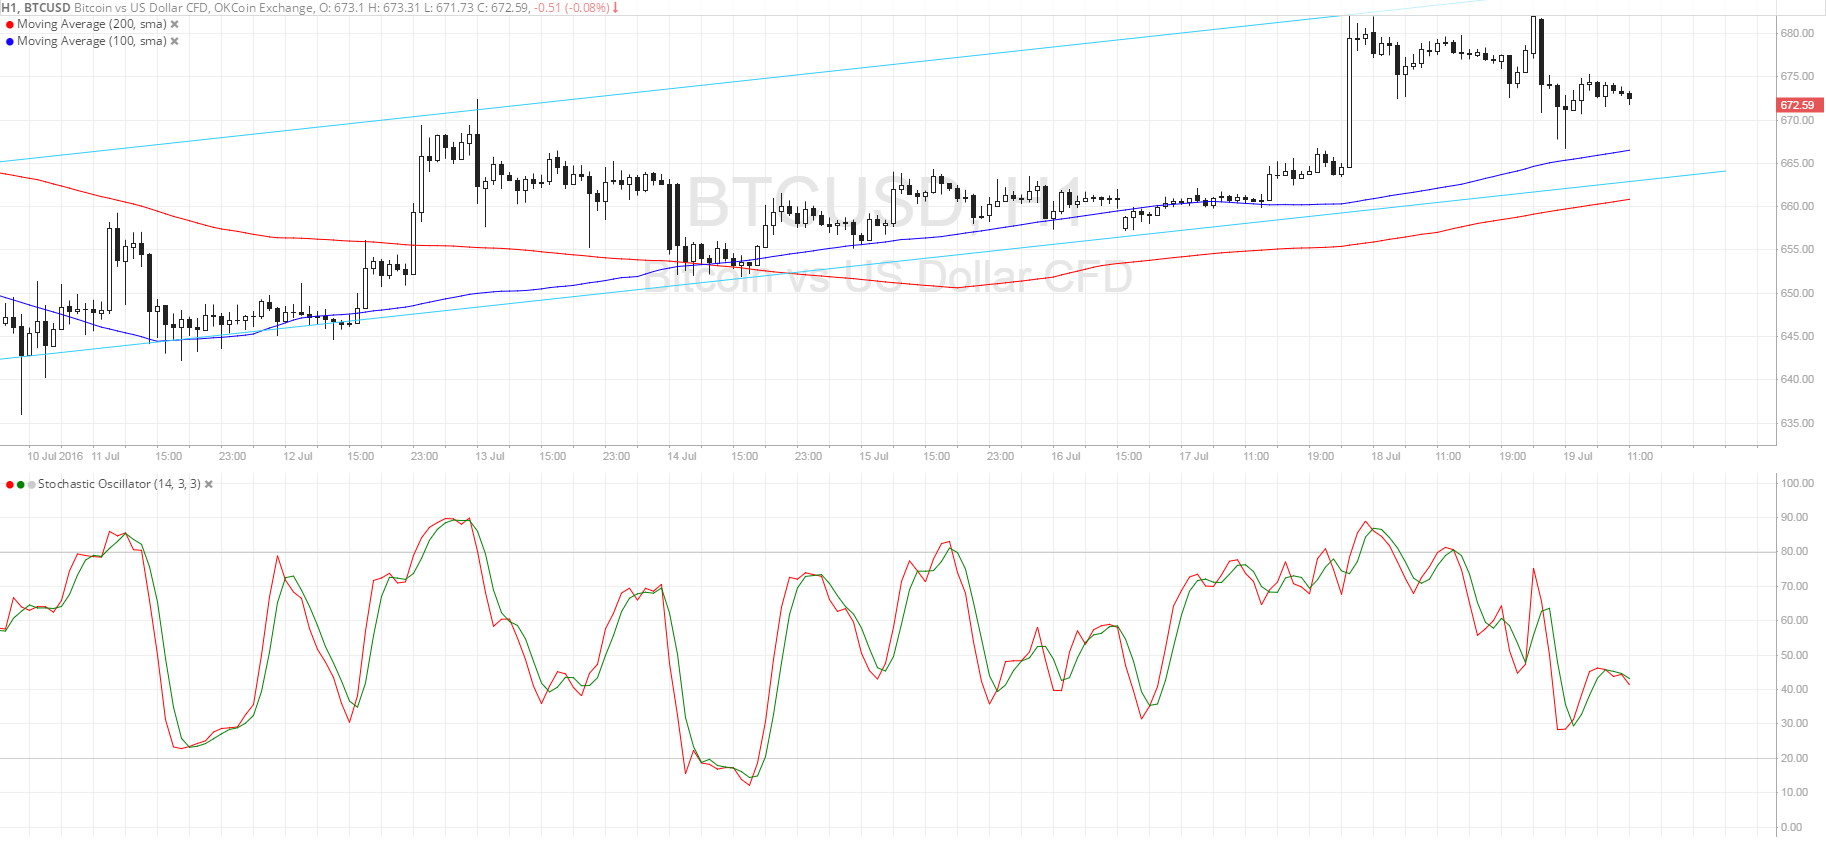
- Bitcoin price is still inside its ascending channel pattern after getting rejected on its attempt to break past the resistance.
- Price could be headed for the channel support for another bounce higher.
- Technical indicators suggest that the uptrend could carry on.
Bitcoin price could be due for a test of the channel support once more, with technical indicators confirming a potential bounce.
Technical Indicators Signals
The 100 SMA lines up with the channel support around $665, adding to its strength as a potential floor. In addition, the 100 SMA is safely above the longer-term 200 SMA for now so the path of least resistance is to the upside. If a bounce takes place, bitcoin price could resume its climb to the previous highs at $680 or higher.
Stochastic seems to be on the move up, although it is turning lower once more. If buyers regain control of bitcoin price action, the uptrend could resume and even go for a break past the channel resistance. On the other hand, a strong return in selling pressure could lead to a break below the channel support and a resulting selloff to the $650-660 area of interest.

Market Events
Strong performance in the US stock market has led traders to let go of some of their bitcoin holdings in pursuit of higher returns in equities. Companies in the tech and banking sectors have mostly reported better than expected quarterly earnings figures, fueling the rise in equity indices and the US dollar so far this week.
There’s not much in the way of economic reports from the US so traders could continue to focus on Q2 earnings data for the rest of the week. Other global indices have also staged small rebounds, possibly recovering from the influx of uncertainty late last week and turning their attention to expectations of stimulus from central banks.
The RBNZ has expressed its intention to introduce lending restrictions in the housing market, perhaps keeping their options open to cut rates if needed. The RBA minutes showed that policymakers were more worried about inflation than they initially seemed while the upcoming ECB decision could also keep easing expectations in play.
Charts from SimpleFX