Bitcoin Price Key Highlights
- Bitcoin price recently broke below a triangle consolidation pattern visible on longer-term charts, signaling that sellers are getting the upper hand.
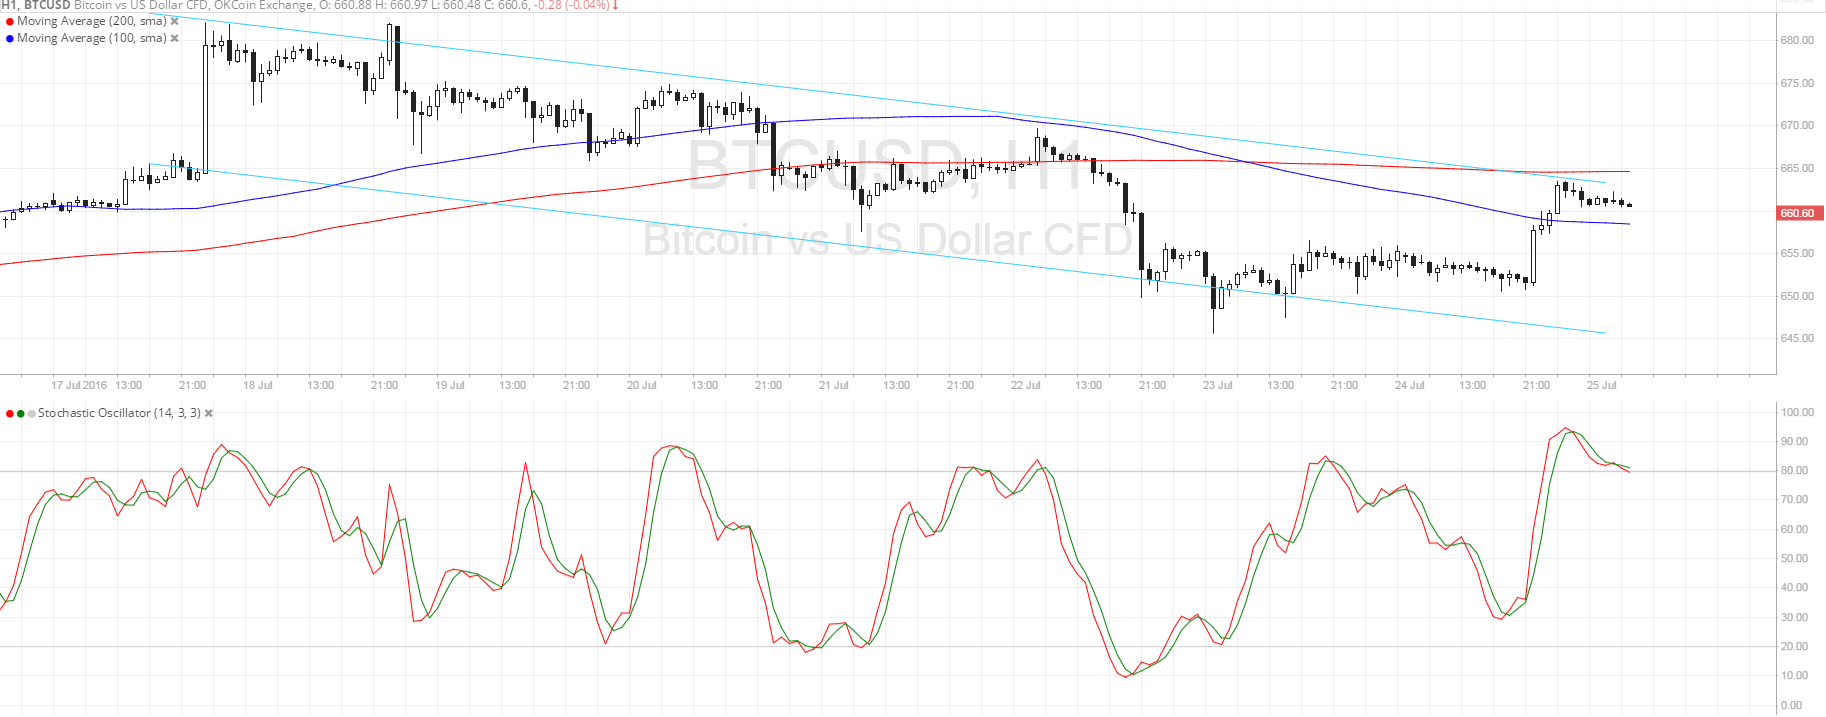
- Price has since formed a steady downtrend on the 1-hour time frame, moving inside a descending channel pattern.
- Bitcoin is now testing the channel resistance, with technical indicators suggesting that the selloff could resume.
Bitcoin price could be ready to resume its dive since technical signals are indicating that bearish pressure is in play.
Technical Indicators Signals
The 100 SMA just recently crossed below the longer-term 200 SMA to indicate that the path of least resistance is to the downside and that the selloff could carry on. In addition, the 200 SMA appears to have held as a dynamic resistance zone, keeping gains in check.
Stochastic is already indicating overbought conditions and is turning lower, which means that buyers are exhausted and that sellers are ready to regain control. A bit of bearish divergence can be seen, as price formed lower highs since July 22 while stochastic had higher highs since then.
If the selloff resumes, bitcoin price could revisit the channel lows at $645-650 while a break past the resistance could allow the uptrend to return, taking price up to area of interest at $670.

Market Events
Central bank events could provide volatility for bitcoin price action this week. In particular, the FOMC statement could determine dollar trends, even though no actual interest rate hikes are expected for now. Still, the Fed’s bias for the rest of the year could determine whether or not the US currency could continue to advance.
The US advanced GDP reading for the second quarter is also up for release this week, with analysts expecting stronger growth for the period compared to the first quarter of 2016. In that case, the US dollar could draw stronger demand compared to other assets, buoyed by stock market gains as well.
The Bank of Japan is also set to announce its monetary policy decision this week and an easing announcement could spur gains for bitcoin price if traders anticipate more uncertainty in global markets.
Charts from SimpleFX