Bitcoin Price Key Highlights
- Bitcoin price has recently broken down from a long-term consolidation pattern, signaling an increase in selling pressure.
- A head and shoulders pattern can be seen on the 1-hour time frame and this is a classic selloff signal.
- Price is still above the neckline of the reversal formation, though, so it’s still early to confirm if further declines are in order.
Bitcoin price has formed a head and shoulders pattern on its short-term time frame and is currently testing the neckline.
Technical Indicators Signals
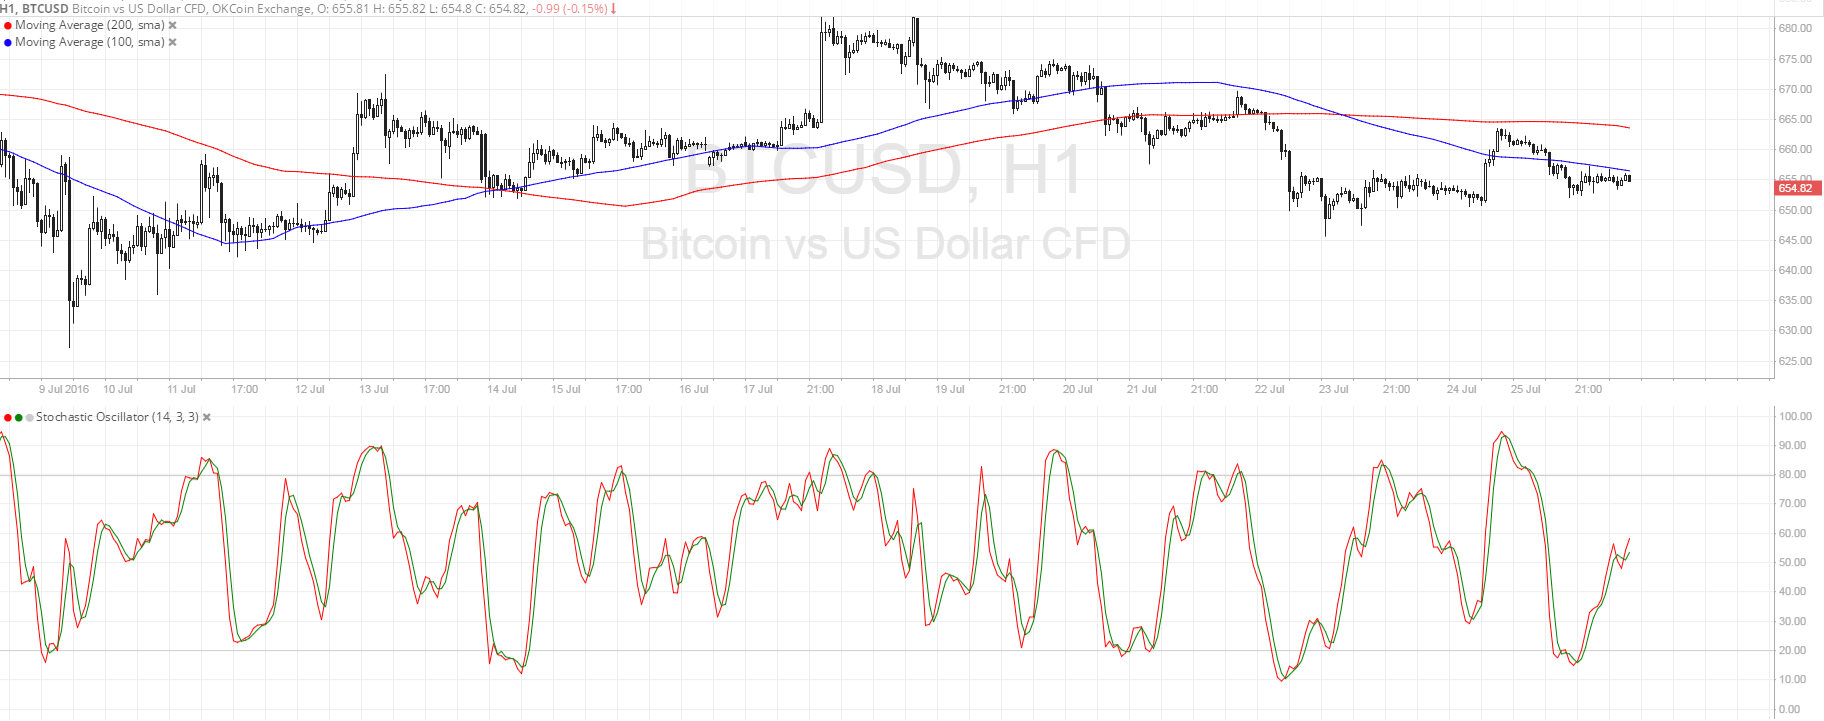
The 100 SMA crossed below the 200 SMA recently, which means that sellers are taking control of bitcoin price action. The gap between the moving averages is widening so bearish momentum is getting stronger. In addition, the 100 SMA appears to be holding as dynamic resistance at the moment.
However, stochastic is heading north so bitcoin price might follow suit. If sellers continue to stay strong, price could just keep treading below the moving averages and eventually break below the neckline at $650.
In that case, bitcoin could be in for more declines, probably of around $30 which is the same height as the chart formation. Stronger selling pressure could take it down to the next major support at $600.

Market Events
Expectations of an upbeat FOMC statement later this week appear to be propping up the US dollar against its counterparts, including bitcoin. Risk aversion is also gripping the financial markets on weaker commodity prices, favoring the safe-haven US dollar as well.
Still, any disappointment from the Fed or stronger words of caution could drive traders away from the US dollar and onto alternative assets like bitcoin and other cryptocurrencies. Other event risks for the week include the Bank of Japan monetary policy decision and the release of Australia’s quarterly CPI, which might fuel rate cut expectations from the Reserve Bank of Australia.
Further commodity price declines appear to be weighing on bitcoin price so far, as crude oil is back to its April lows. Apart from all that, profit-taking on the recent bitcoin rallies also appears to be in play.
Charts from SimpleFX