Bitcoin Price Key Highlights
- Bitcoin price recently formed a head and shoulders pattern on its short-term time frames, signaling that the recent uptrend may be over.
- Price has broken below the neckline support, which held as resistance on the retest.
- This adds confirmation that further losses are possible so it’s time to look at the nearby inflection points and areas of interest for potential targets.
Bitcoin price seems to be establishing a downtrend after confirming a reversal pattern, and technical indicators support this view.
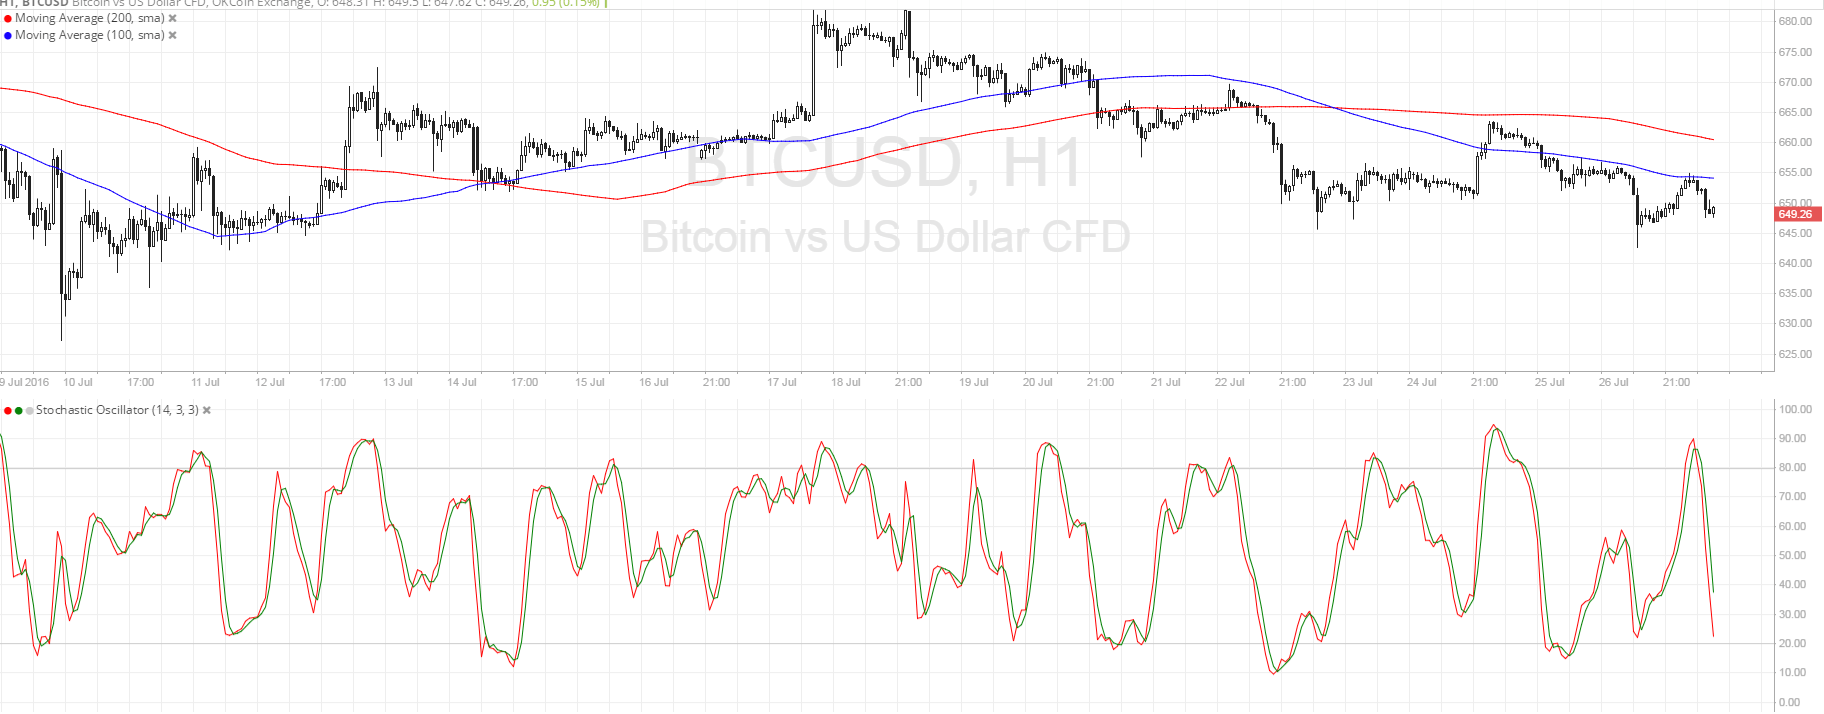
Technical Indicators Signals
The 100 SMA is still below the 200 SMA so this selloff could carry on. In addition, the 100 SMA appears to have held as a dynamic resistance area from here, as it coincided with the pullback to the broken head and shoulders neckline at $655.
Bitcoin price is still stalling at the near-term support around $650 but a break below this area could draw more sellers to the mix. Stochastic is still pointing down and heading south so price could follow suit, possibly setting its sights on the lows near $630.
Keep in mind, however, that stochastic is also nearing the oversold area so a turn in the oscillator could spark a bit of profit-taking as sellers take a break. If bullish pressure is strong enough, a stronger bounce could be seen.

Market Events
Data from the US economy has been mostly stronger than expected, which explains the pickup in demand for the dollar against its counterparts. This has led traders to expect upbeat remarks from Fed policymakers in today’s FOMC statement, possibly keeping hopes of an interest rate hike for this year alive.
Apart from that, the decline in commodity prices is also keeping a bit of risk aversion in play, also supporting the safe-haven US currency. Speculations of an inventory buildup are weighing on crude oil prices, although that could change upon the release of the EIA data, which might show a reduction of 2.1 million barrels and ease fears of an oversupply.
In any case, be on the lookout for additional bitcoin price volatility during the FOMC statement as any downbeat remarks could lead to USD weakness and therefore bitcoin rallies.
Chart from SimpleFX