Bitcoin Price Key Highlights
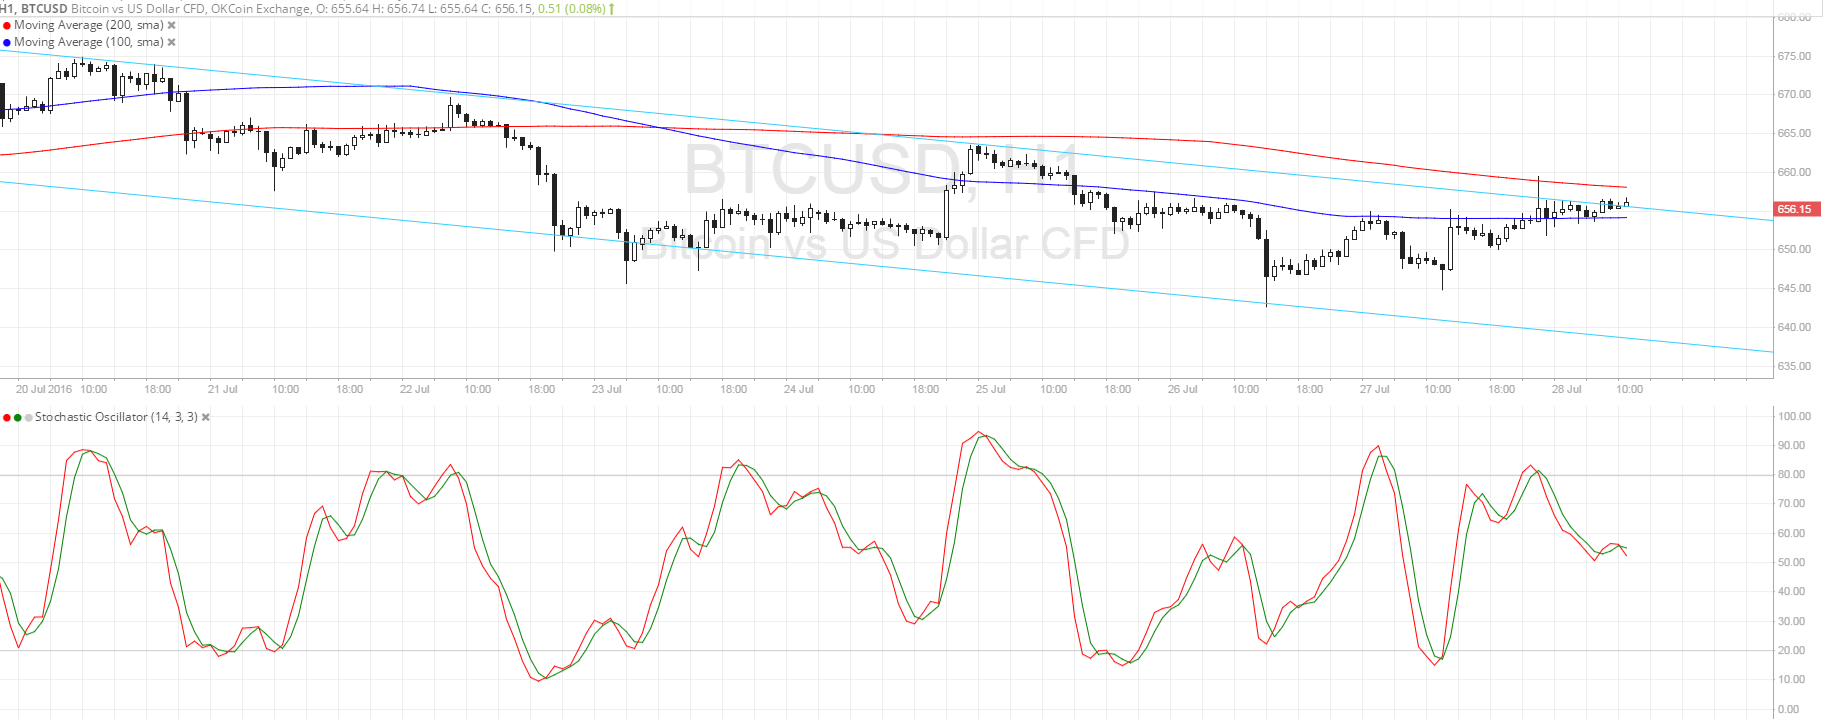
- Bitcoin price seems to be establishing a downtrend now that it’s forming a descending channel on its 1-hour time frame.
- Price is now testing the channel resistance, still deciding whether to make a bounce or a break.
- Technical indicators seem to be indicating that the selloff could resume but there are also potential arguments for a reversal.
Bitcoin price is hovering at the resistance of the short-term descending channel and could be in for a continuation or reversal.
Technical Indicators Signals
The 100 SMA is below the longer-term 200 SMA so the path of least resistance is to the downside, which could take bitcoin price to the channel support at $640. The 200 SMA could hold as a dynamic inflection point and add strength to the channel resistance at $655.
However, the gap between the moving averages is narrowing, hinting that an upward crossover could be possible. In that case, buyers could jump in the potential reversal, especially if a long bullish candle closes above $660.
Stochastic is pointing down and moving south so bitcoin price could follow suit. A bit of bearish divergence can be seen since stochastic made lower highs while bitcoin had higher highs from yesterday. Keep in mind, however, that a double pattern seems to be forming with a neckline at $660 so a break past that area could confirm a likely rally.

Market Events
The FOMC statement was relatively hawkish as the Fed upgraded its assessment of employment and spending, keeping speculations for a rate hike this year alive. Instead of spurring dollar gains, however, this event turned out positive for market sentiment and encouraged risk-taking.
This behavior affected bitcoin price action against the dollar, allowing the cryptocurrency to take advantage of dollar weakness. Should this environment persist, an upside breakout and rally could take place but profit-taking by the end of the week could also happen and allow the trend to resume.
The US has yet to print its Q2 GDP reading by the end of the trading week and the outcome could also renew dollar strength if the figures beat expectations.
Charts from SimpleFX