Bitcoin Price Key Highlights
- Bitcoin price has been trending lower recently but it looks like sellers are tired from the decline.
- A small reversal pattern can be seen on the 1-hour time frame, possibly indicating a short-term reversal.
- Price has failed in its last two attempts to break below the $645 level, creating a double bottom formation.
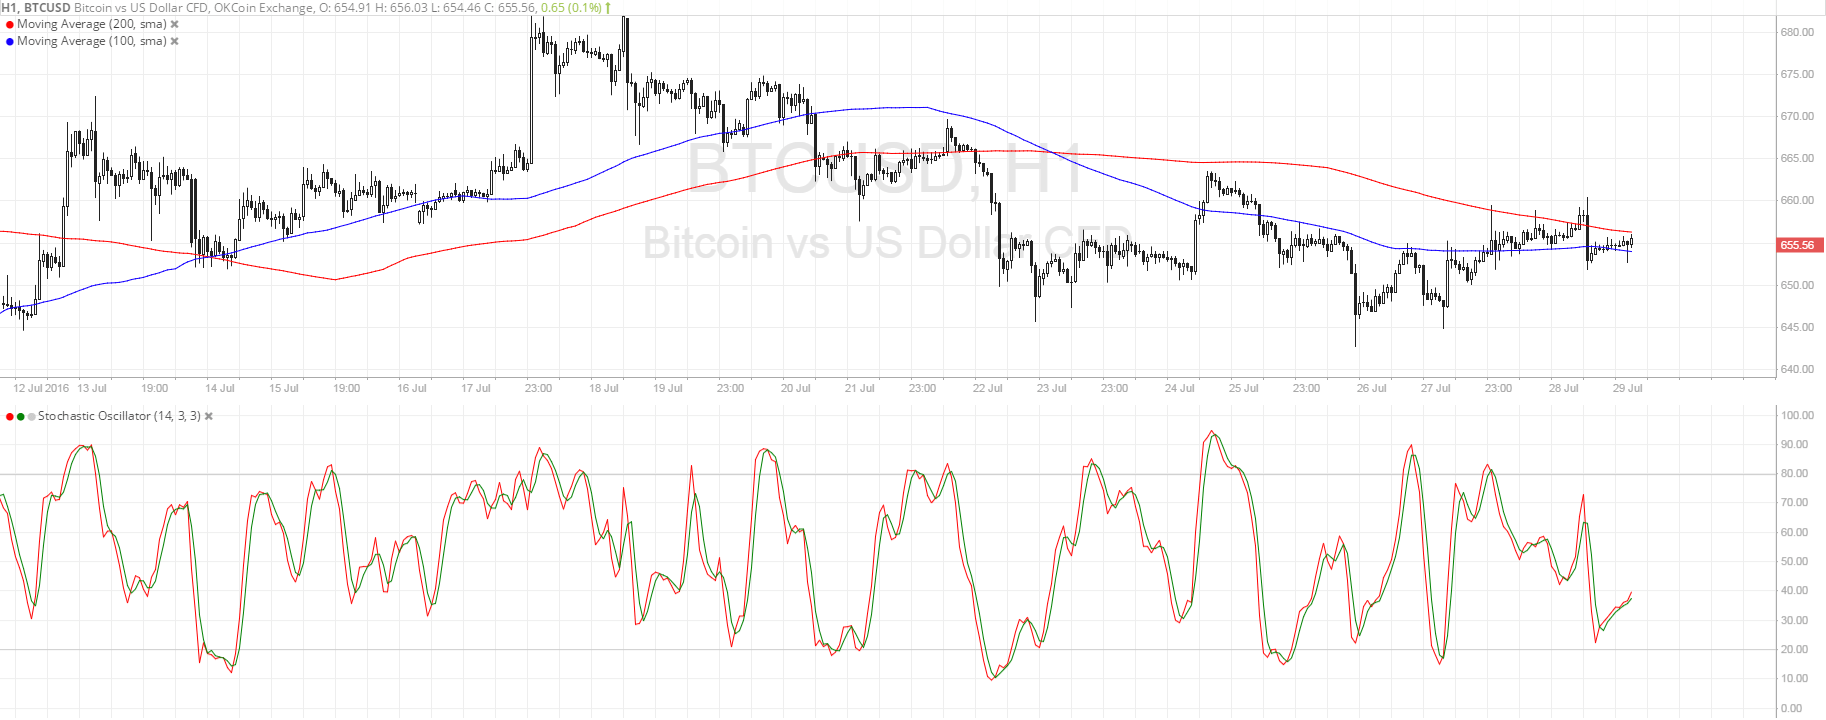
Bitcoin price has formed a double bottom on its 1-hour time frame but has yet to break above the neckline before confirming the reversal.
Technical Indicators Signals
The 100 SMA is still below the longer-term 200 SMA so the path of least resistance is to the downside and the selloff could carry on. However, the gap between the moving averages is narrowing so an upward crossover could take place and draw buyers to the mix.
In that case, bitcoin price could have enough momentum to break past the double bottom neckline at $665 then aim for the next resistance at $680. Stochastic is pointing up to indicate that buyers are taking control of price action.
However, if sellers regain control, price could make another test of the support at $645 and a downside break could send it to the major support at the $600 area.

Market Events
Risk aversion appears to have returned in the financial markets recently, as a couple of uncertainties surfaced in the European region. In Spain, the King asked PM Rajoy to hold a vote of confidence since the elections failed to result to a majority government. In Italy, the banking crisis seems to be getting worse as its third-largest bank failed to secure a cash injection from a group of large banks and institutional lenders.
The US is set to print its advanced GDP reading for Q2 in today’s US session, with traders anticipating a 2.6% growth figure. This would be a faster pace of expansion compared to the 1.1% reading in Q1, reinforcing rate hike expectations for September. Stronger than expected data could lead a move lower for bitcoin price, as the dollar would be supported by fundamentals and risk sentiment.
Charts from SimpleFX