Bitcoin Price Key Highlights
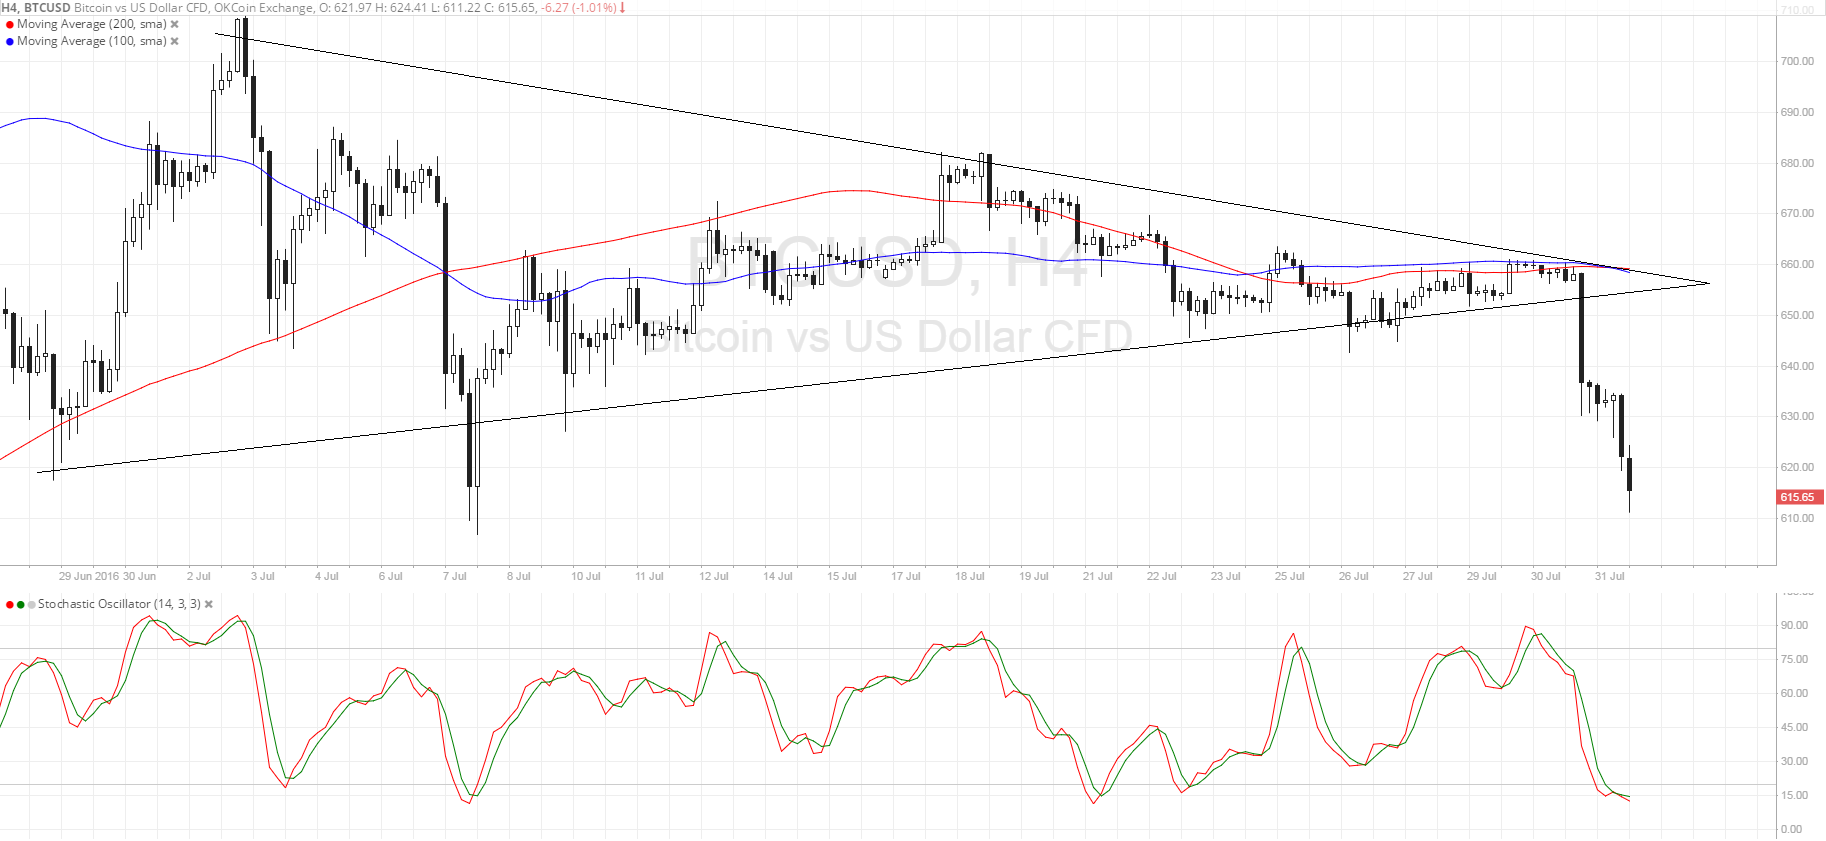
- Bitcoin price was trading inside a symmetrical triangle pattern before a strong breakdown ensued.
- An early signal for this selloff materialized on the 1-hour time frame when price broke below a head and shoulders pattern.
- Economic reports released last Friday seemed to be the main catalyst for the big move.
Bitcoin price made a sharp breakdown from consolidation recently, signaling that a longer-term downtrend could take place.
Technical Indicators Signals
The 100 SMA and 200 SMA are still oscillating, as the moving averages have yet to incorporate the recent drop. These indicators line up with the top of the triangle, which add to its strength as a ceiling.
Stochastic is heading south but is nearing the oversold region, which suggests that sellers might be feeling exhausted and ready to let buyers take over. In that case, a pullback to the broken triangle support around $650 could be possible before bitcoin price resumes its selloff.
However, if buying pressure is strong enough, bulls could push bitcoin price past the triangle resistance at $660 and onto an uptrend. On the other hand, continued selling pressure could lead to a drop to the next long-term support at $600.

Market Events
The US advanced GDP reading for the second quarter of the year turned out much weaker than expected, as the economy expanded only 1.2%. This was significantly lower than the projected 2.6% growth figure and only a notch higher than the previous period’s 1.1% growth, which means that the US economy didn’t make such a strong rebound.
This weakened rate hike expectations for September and possibly even for the rest of the year. The dollar weakened across the board in the forex arena but managed to advance against bitcoin price as risk aversion took hold of the market.
With weaker than expected US GDP growth, global economic performance could continue to slow, leading traders to flock back to the safe-haven dollar versus higher-yielding assets like bitcoin. Note that the triangle pattern is around $100 in height so the resulting selloff could last by the same amount, possibly taking price down to $550.
Charts from SimpleFX