Bitcoin Price Key Highlights
- Bitcoin price recently made a strong break from a short-term consolidation pattern, signaling that sellers have taken control.
- However, the longer-term uptrend remains intact and price could be ready for a test of the key support.
- A rising trend line can be drawn to connect the lows on the daily time frame and bitcoin price seems to be headed towards this area.
Bitcoin price could be due for a test of the longer-term rising trend line visible on the daily chart.
Technical Indicators Signals
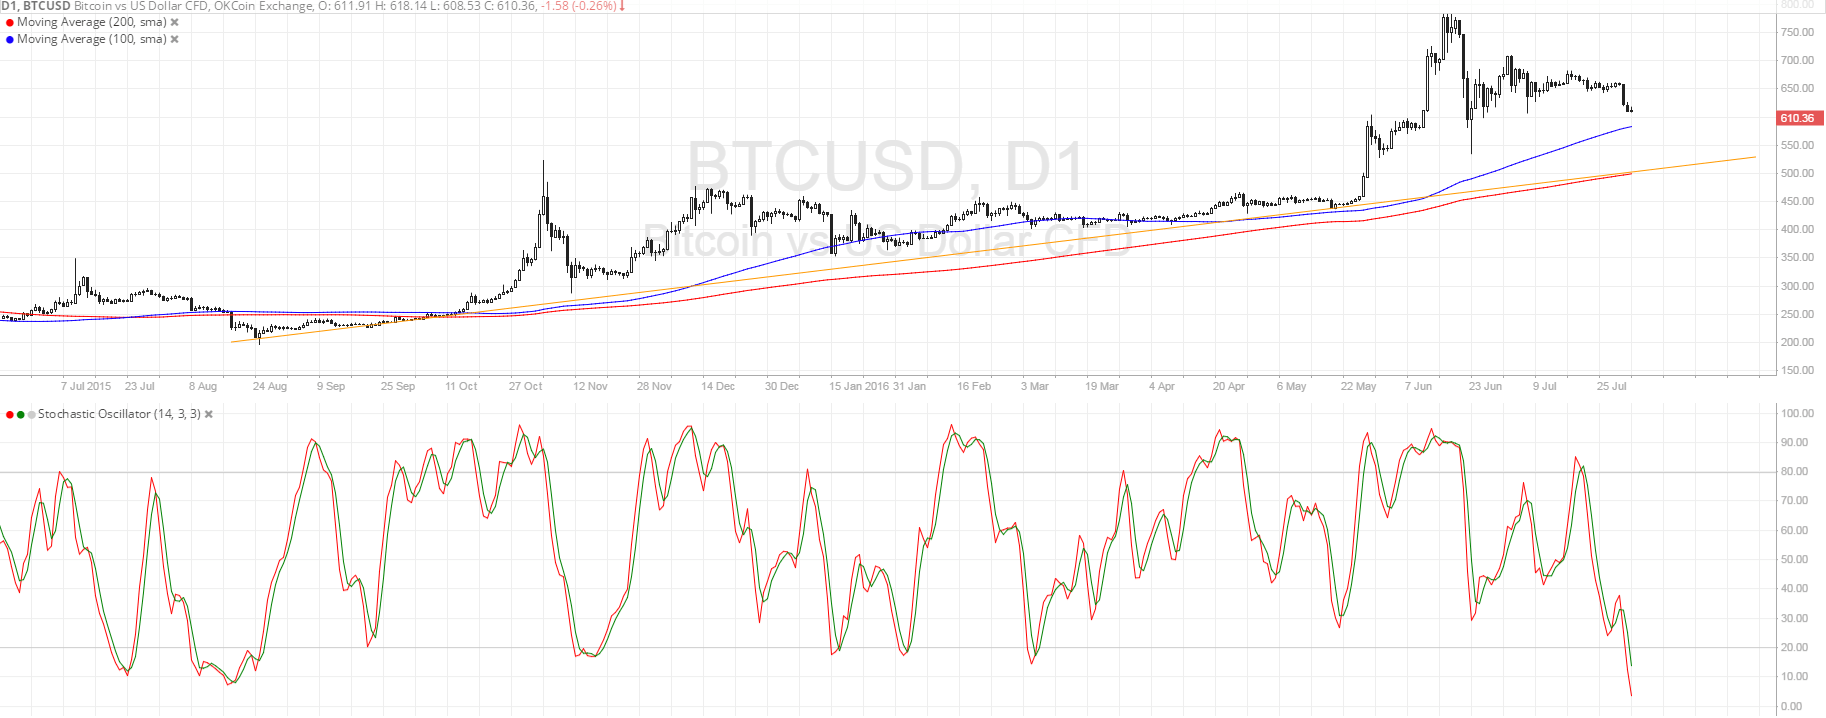
On the daily time frame, the 100 SMA is above the 200 SMA so the longer-term uptrend could carry on. In addition, the gap between the moving averages is still widening so the bullish momentum could strengthen after this pullback. Price is already nearing the 100 SMA which might hold as dynamic support, but a larger retracement could last until the 200 SMA which lines up with the rising trend line.
Stochastic is already in the oversold area, which suggests that sellers are already exhausted and that buyers are about to take over. However, the oscillator has yet to turn higher to indicate a return in buying pressure. For now, declines could still be possible while stochastic heads south.

Market Events
Risk aversion remained in play at the start of the week, as the downbeat US advanced GDP reading printed last Friday sparked fears of a global slowdown. The economy expanded by only 1.2% during the second quarter of 2016 versus the projected 2.6% growth figure.
Up ahead, central bank decisions are looming, with both the Reserve Bank of Australia and the Bank of England rumored to increase their stimulus efforts. In particular, the RBA is expected to slash rates from 1.75% to 1.50% today while the BOE could lower rates from 0.50% to 0.25% on Thursday.
Policy adjustments could draw traders back to cryptocurrencies to avoid lower returns on currencies and equities, thereby driving bitcoin price higher again. For now, however, it looks like the selloff in commodities is weighing on riskier assets like bitcoin and might continue to do so until market sentiment shifts.
Charts from SimpleFX