Bitcoin Price Key Highlights
- Bitcoin price was rejected on its attempt to break past the ascending triangle resistance.
- Price is now back to testing support around $2700 and could be due for another bounce.
- Technical indicators are giving mixed signals so there may still be some indecision between buyers and sellers.
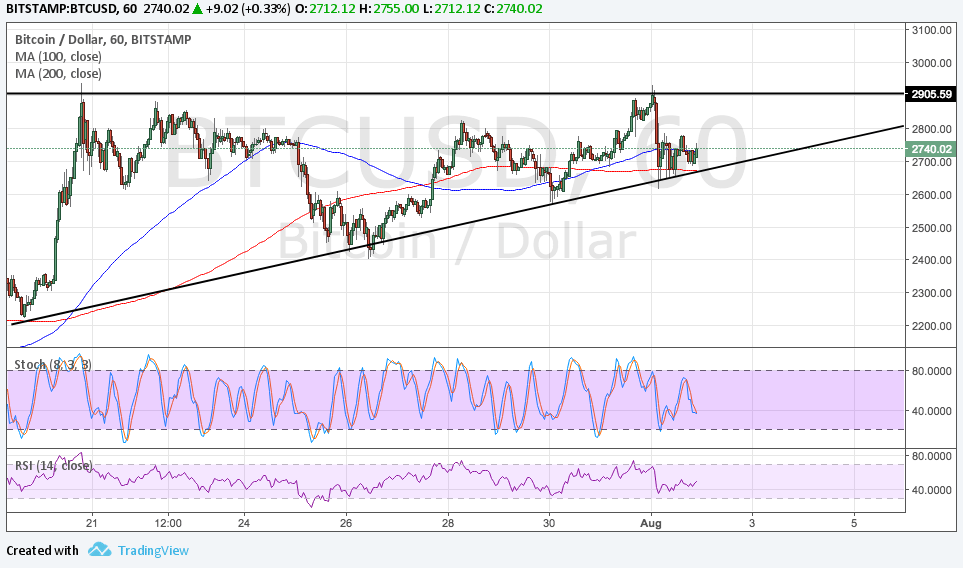
Bitcoin price is still consolidating inside its ascending triangle formation visible on the short-term time frames.
Technical Indicators Signals
The 100 SMA is above the longer-term 200 SMA so the path of least resistance is to the upside. Also, the 200 SMA lines up with the bottom of the triangle to add to its strength as a floor.
Stochastic is on the move down to show that sellers are in control of price action and might even push for a downside break. Note that the formation spans $2200 to $2900 so the resulting selloff could be around $700.
RSI appears to be turning higher even without hitting the oversold level, which also suggests that buyers are eager to get back in the game. Stronger bullish momentum could even lead to a break past the triangle resistance and possibly the creation of new highs.

Market Factors
The US dollar has regained its footing against its peers after President Trump patted himself on the back for stronger than expected Q2 GDP and medium-tier data came in mostly in line with estimates.
Meanwhile, Bitcoin has split into two after a rival version of the software forced a hard fork. Surprisingly, this didn’t trigger a steep selloff for the cryptocurrency as investors still remain hopeful that one version will garner more network acceptance.
The main Bitcoin system has upgraded to SegWit2x while the new cryptocurrency is being supported by only a few exchanges. This way, Bitcoin can be able to handle more transactions but many can’t help but worry about incompatibility issues.
Headlines are saying that the clone version is off to a slow start and may lose traction eventually, forcing the entire network to revert to the original one.
SaveSave
SaveSave