Bitcoin Price Key Highlights
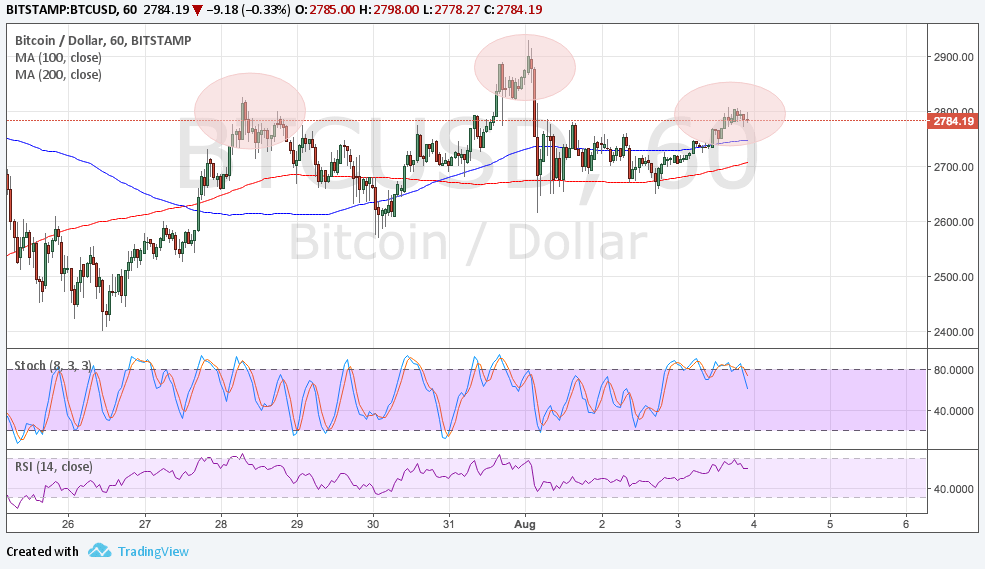
- Bitcoin price appears to be forming a head and shoulders pattern on its 1-hour chart to signal that a downtrend is in order.
- Price has yet to complete the right shoulder and test the neckline at $2700 before confirming the potential selloff.
- Resistance at the $2800 level could hold as oscillators are signaling a return in bearish pressure.
Bitcoin price is on track towards forming a head and shoulders pattern, which is a classic downtrend signal.
Technical Indicators Signals
The 100 SMA is still above the longer-term 200 SMA so the path of least resistance is to the upside. However, the moving averages have also been oscillating so there’s a change that another downward crossover could happen and price could fall to the neckline.
This neckline support lines up with the 200 SMA dynamic inflection point, adding to its strength as a floor. The chart pattern spans $2700 to $2900 so the resulting selloff could be of the same size, taking bitcoin price to $2500 next.
Stochastic has hit overbought levels and is turning lower to indicate a return in bearish momentum. RSI is also ready to move south so bitcoin price might follow suit.

Market Factors
Bitcoin price failed to secure enough bullish energy to break past the all-time highs as the cryptocurrency was split into two different versions earlier this month. The lack of incompatibilities so far has kept bitcoin price afloat but it looks like market watchers are not keen on boosting it either.
For now, the attention shifts back to the dollar as the US economy will release its July NFP report. This could set the tone for future Fed policy action as downbeat readings could delay the next rate hike to December or next year while an upside surprise could keep September tightening expectations strong.
Leading indicators have already set the bar low as the ISM surveys and ADP figure signaled a slowdown in hiring. Analysts are expecting to see a 188K rise in employment for the month, slower than the previous figure, but revisions to earlier reports are also expected.