Bitcoin Price Key Highlights
- Bitcoin price is still in the middle of a correction from its recent dive.
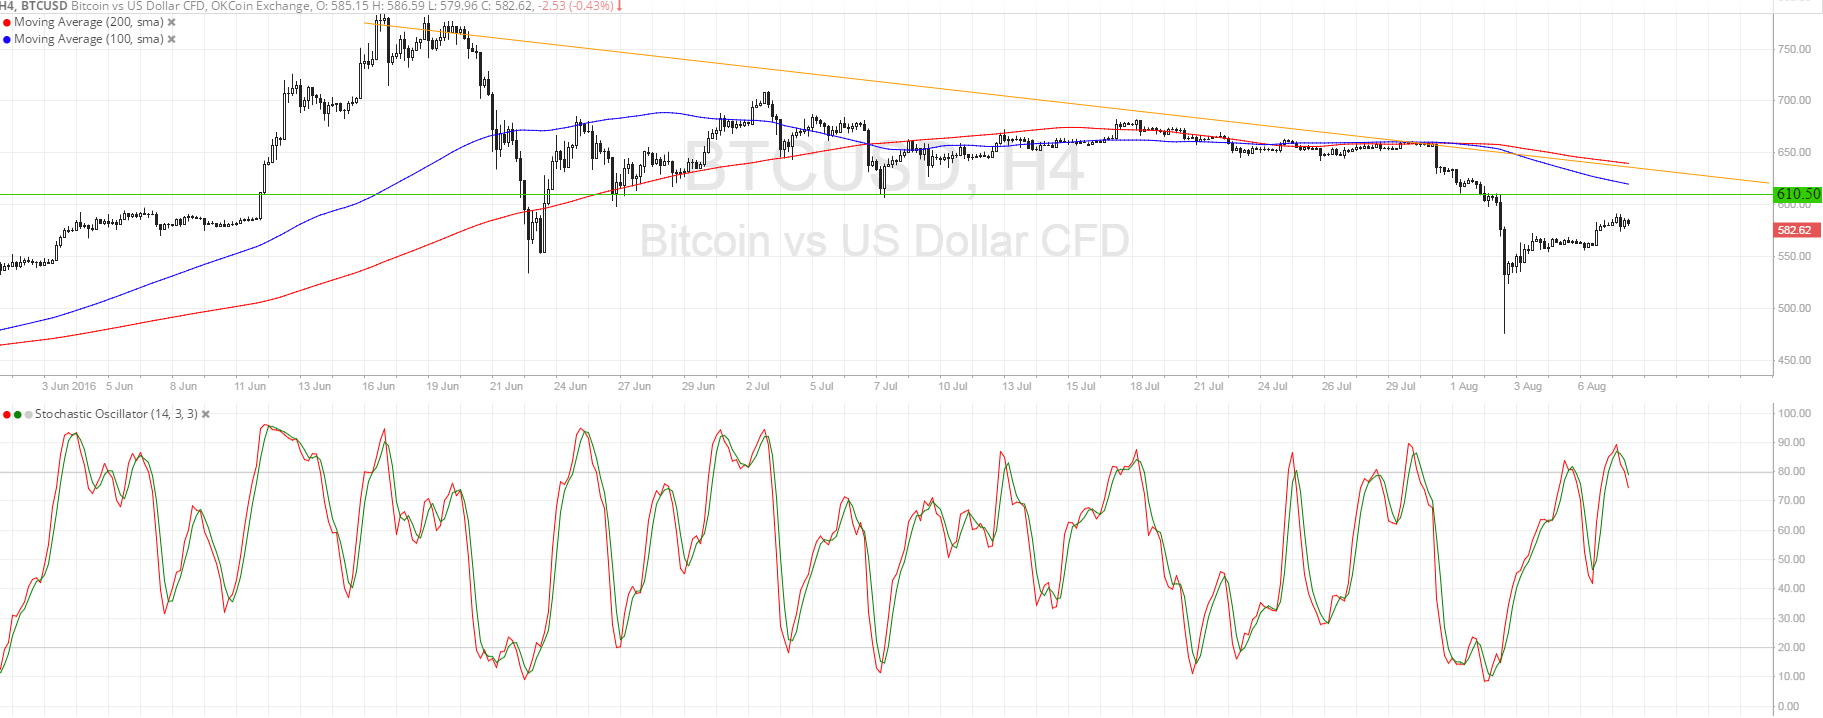
- A descending trend line can be drawn to connect the recent highs of price action on the 4-hour time frame.
- This trend line coincides with several areas of interest where bears could be waiting with sell orders.
Bitcoin price could be ready to resume its slide after it tests the nearby resistance around $610-620.
Technical Indicators Signals
The 100 SMA is below the 200 SMA on the 4-hour chart so the path of least resistance is still to the downside. In addition, the gap between the moving averages is widening, which means that bearish pressure is strengthening.
These moving averages are within the vicinity of the area of interest, which previously held as support and could now hold as resistance. A move past the trend line at $620 could signal the start of a reversal from the ongoing downtrend.
Stochastic is already in the overbought zone and is turning lower, suggesting that sellers are already taking control of price action. Further downside action from the oscillator could draw more bears to the mix and push bitcoin price back down to the lows at $475.

Market Events
Stronger than expected US jobs data didn’t seem to be enough to spur a dollar rally against bitcoin price on Friday, signaling that profit-taking from the recent slump is still in play. The US economy added 255K jobs in July, higher than the estimated 180K gain and enough to spur rate hike talks for September.
There are no major US reports up for release today, although the retail sales data due on Friday could have an impact on bitcoin price action then. The main event risk on the economic calendar this week is the rate statement from the Reserve Bank of New Zealand, which is also expected to announce a 0.25% rate cut.
In that case, bitcoin price could continue to advance across the charts as easy monetary policy would drive investors to seek higher returns in other assets such as cryptocurrencies.
Charts from SimpleFX