Bitcoin Price Key Highlights
- Bitcoin price is slowly climbing, moving above a rising trend line on its 30-minute and 1-hour time frames.
- Price is currently testing this rising trend line support, with technical indicators suggesting that a bounce could take place.
- A return in bullish pressure could take bitcoin price back up to the previous resistance at $590 or higher.
Bitcoin price is currently testing the rising trend line visible on its 1-hour time frames and could be ready to resume its climb.
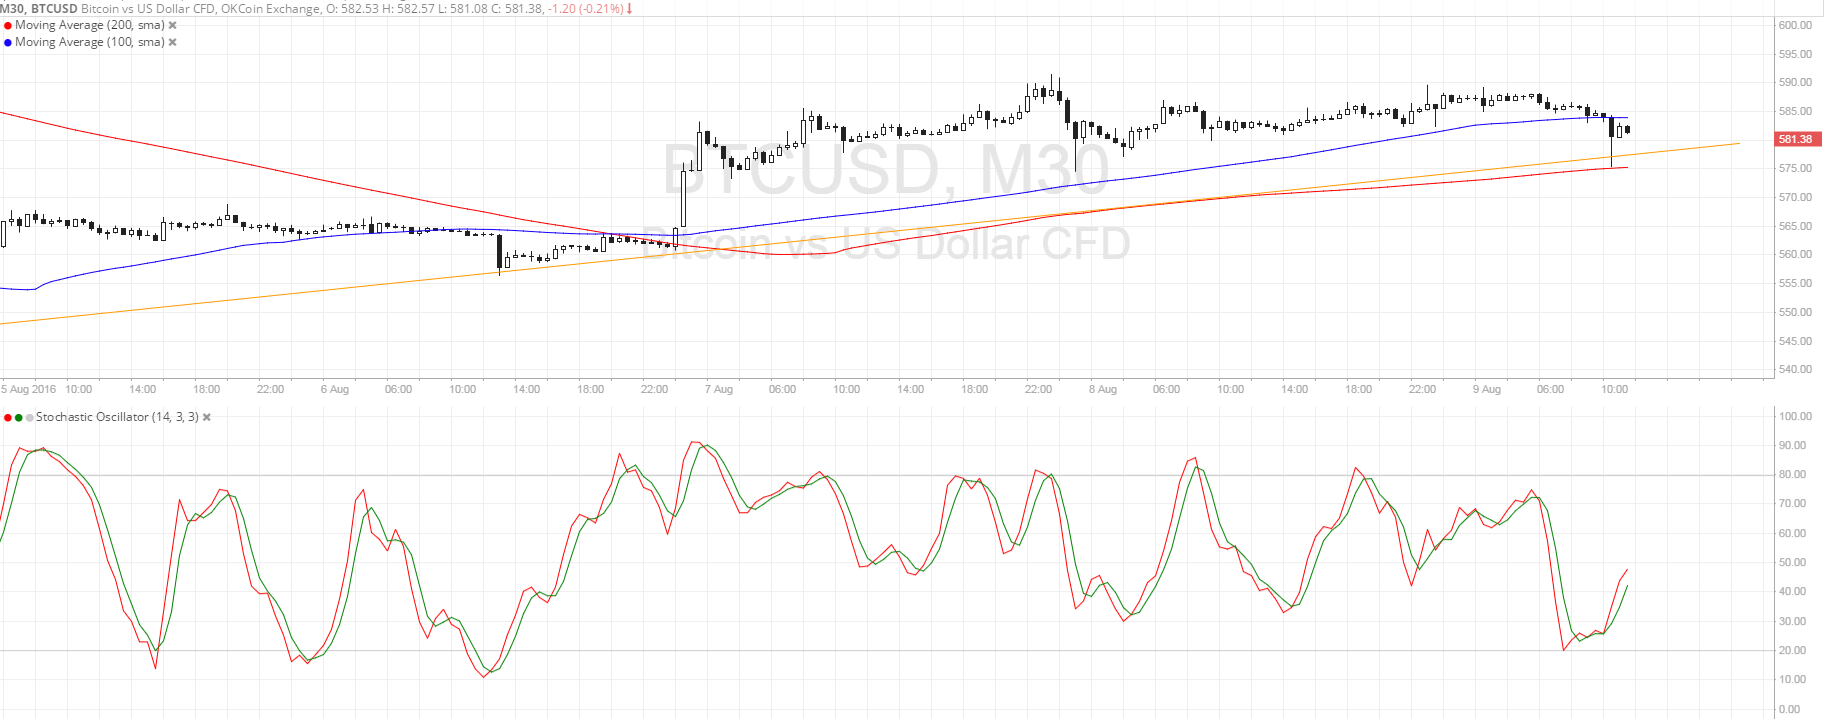
Technical Indicators Signals
The 100 SMA is above the longer-term 200 SMA, which confirms that the path of least resistance is to the upside and that the rally could resume. In addition, the 200 SMA lines up with the rising trend line, adding to its strength as a floor.
For now, bitcoin price has dipped below the 100 SMA dynamic inflection point, signaling a bit of bearish pressure. Stochastic is pointing up on its way out of the oversold region, which means that buyers are regaining control of price action.
Also, the gap between the moving averages is widening, which means that buyers are getting stronger and could be ready to push for more gains past the $600 handle.

Market Events
It appears that profit-taking off the sharp slide in bitcoin price from the previous weeks is still in play. After all, the selloff was mostly spurred by a hack in a Hong Kong bitcoin exchange so now that investigations are ongoing and security measures are being put in place, market confidence seems to be returning.
There are hardly any economic catalysts scheduled for the week, apart from the interest rate statement from the Reserve Bank of New Zealand. Even so, a rate cut is already being priced in so the market might not have such a huge reaction to the announcement.
As for the US dollar, the currency is putting up a strong fight against its rivals, thanks to strongly improving labor conditions. Still, this is also enough to keep risk-taking in place, favoring higher-yielding assets such as bitcoin and other cryptocurrencies.
Charts from SimpleFX