Bitcoin Price Key Highlights
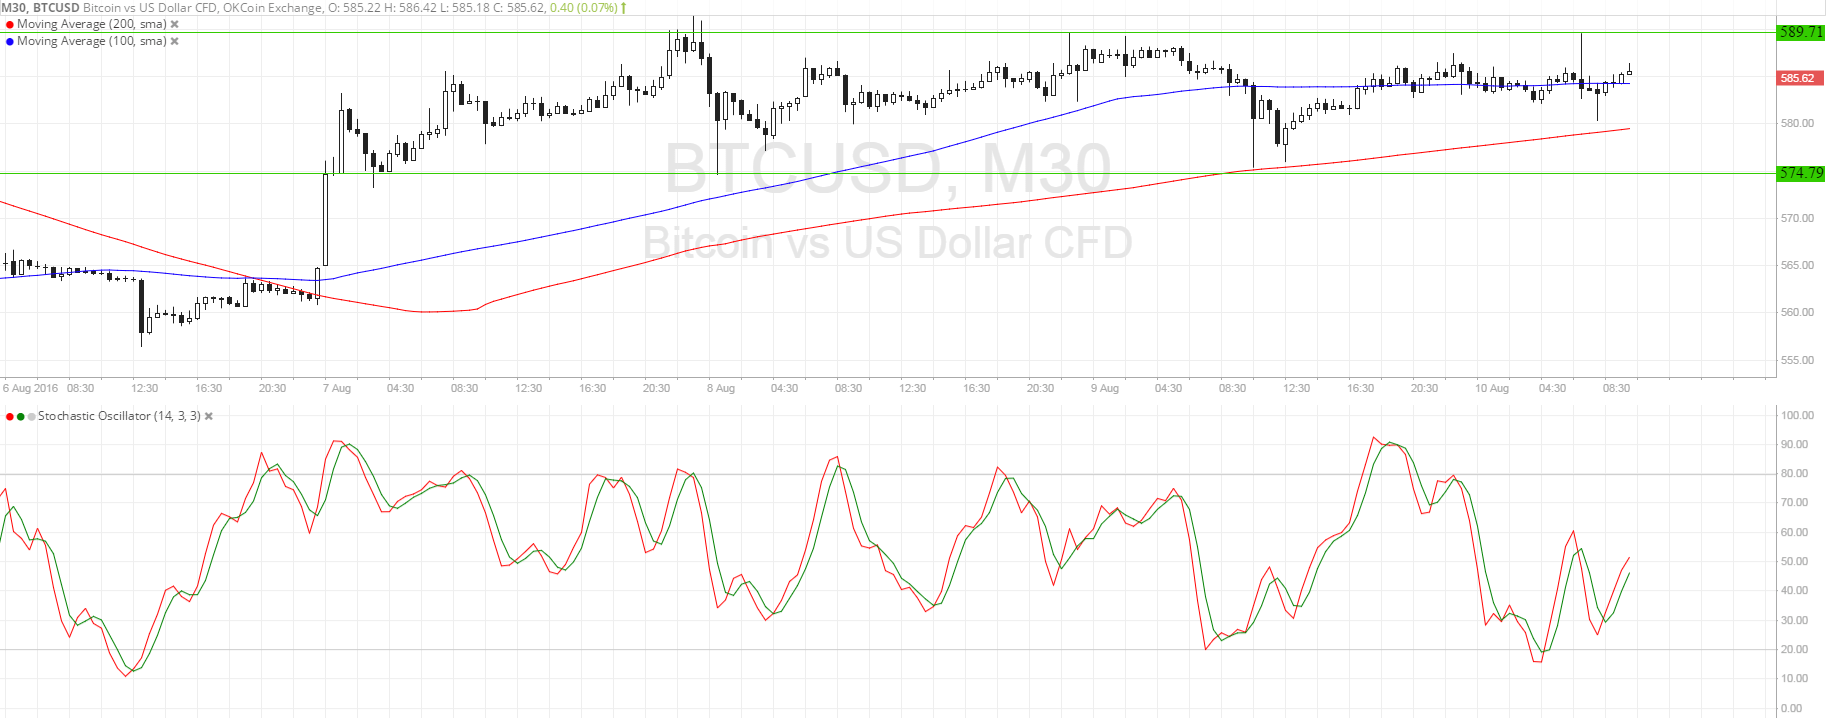
- Bitcoin price has been moving sideways on the slowdown in volatility, stuck in a range between support at $575 and resistance at $590.
- Price appears to be bouncing off the top of the range once more, gearing up for another test of support.
- However, technical indicators are suggesting that a breakout could take place.
Bitcoin price is settling inside a range but technical indicators seem to be hinting at an upside breakout.
Technical Indicators Signals
The 100 SMA is still above the longer-term 200 SMA on this time frame, signaling that the path of least resistance is to the upside. Price is currently testing the dynamic support at the 100 SMA, with another potential floor at the 200 SMA nearby. The gap between the moving averages seems to be narrowing, suggesting a possible downward crossover later on.
Stochastic is on the move up so bitcoin price might follow suit. An upside breakout past the $590 range resistance could take it higher by an additional $15, which is the same height as the short-term rectangle formation. On the other hand, a long bearish candle closing below $575 could take bitcoin price down by $15 as well.

Market Events
The lack of market-moving catalysts compared to previous weeks has led to a lull in bitcoin price action. Central banks have announced monetary policy changes last week while the hack in a Hong Kong exchange has weighed heavily on bitcoin price. Soon after, traders booked profits off the sharp drop and are now waiting for more market clues.
A potential catalyst for price action could be the Reserve Bank of New Zealand’s policy decision since this might affect overall market sentiment and dollar trading, but this event is not expected to have a large direct impact on bitcoin price. For now, consolidation could continue for the cryptocurrency, allowing traders to just play the range support and resistance.
The US is set to print its retail sales report on Friday and might spur strong moves for the dollar, thereby dragging bitcoin price around. Downbeat data could mean losses for the US currency and therefore gains for bitcoin.
Chart from SimpleFX