Bitcoin Price Key Highlights
- Bitcoin price seems to be stalling from its climb and might form a short-term reversal pattern.
- A head and shoulders formation looks imminent on the 1-hour time frame if price dips back to the $3300 support.
- A break below this neckline could confirm the potential selloff, which might mean around $200 in losses.
Bitcoin price is in the middle of forming a head and shoulders pattern on its short-term chart if bulls have trouble sustaining the climb.
Technical Indicators Signals
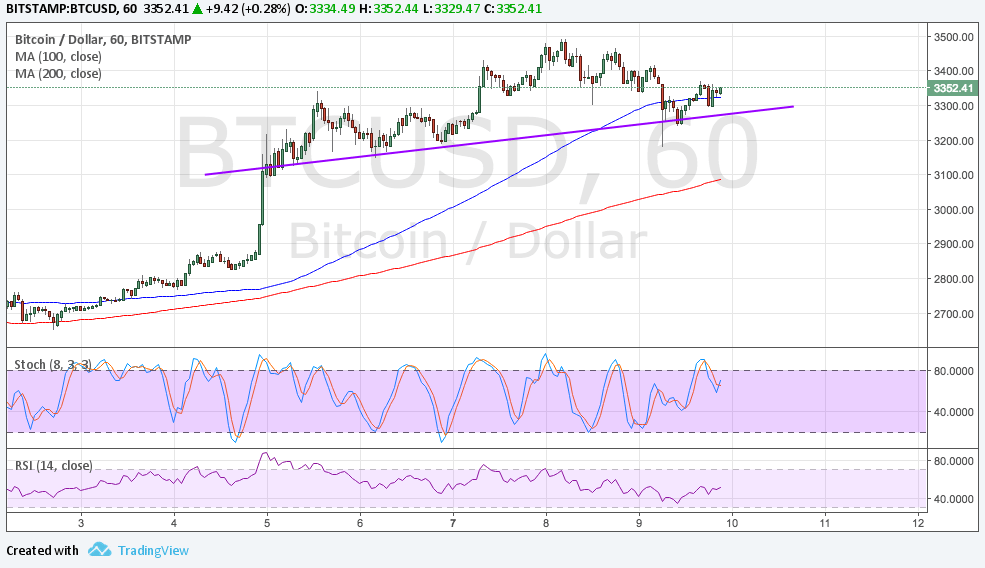
The 100 SMA is above the longer-term 200 SMA so the path of least resistance is to the upside. In other words, the rally is more likely to carry on than to reverse. Price is also finding support at the 100 SMA dynamic inflection point for now.
The chart pattern is approximately $200 tall so the resulting drop could be of the same size, taking it down to the 200 SMA dynamic support next. Stochastic is heading down from the overbought area so bitcoin price might follow suit. RSI, on the other hand, is turning higher to signal the presence of bullish pressure.

Market Factors
Rising geopolitical risks from the escalating tension with North Korea could keep bitcoin price supported in the near term. Cryptocurrencies typically enjoy stronger demand during these situations as investors seek high returns outside of traditional assets like stocks or commodities.
Apart from that, the bitcoin network upgrade also keeps this particular digital asset supported as it allows the handling of more transactions. There have been no major issues for nearly a week already so investors are increasingly confident that the transition has been smooth.
However, the US dollar is also drawing support from upbeat leading indicators that support the odds of a September interest rate hike. Markets are turning to the US CPI release on Friday to see if one more tightening move is possible, along with the start of the balance sheet runoff around the same time.
Market sentiment could remain the bigger driver of bitcoin price action until then as headlines on North Korea could influence overall risk appetite and spur more volatility than usual.