Bitcoin Price Key Highlights
- Bitcoin price bounced off the bottom of its short-term ascending channel and climbed to the top.
- The channel resistance kept gains in check, putting bitcoin back on track towards testing support again.
- Technical indicators are showing that the uptrend could continue but that a pullback might be in the cards.
Bitcoin price could be ready to test the bottom of the rising channel, which lines up with several inflection points.
Technical Indicators Signals
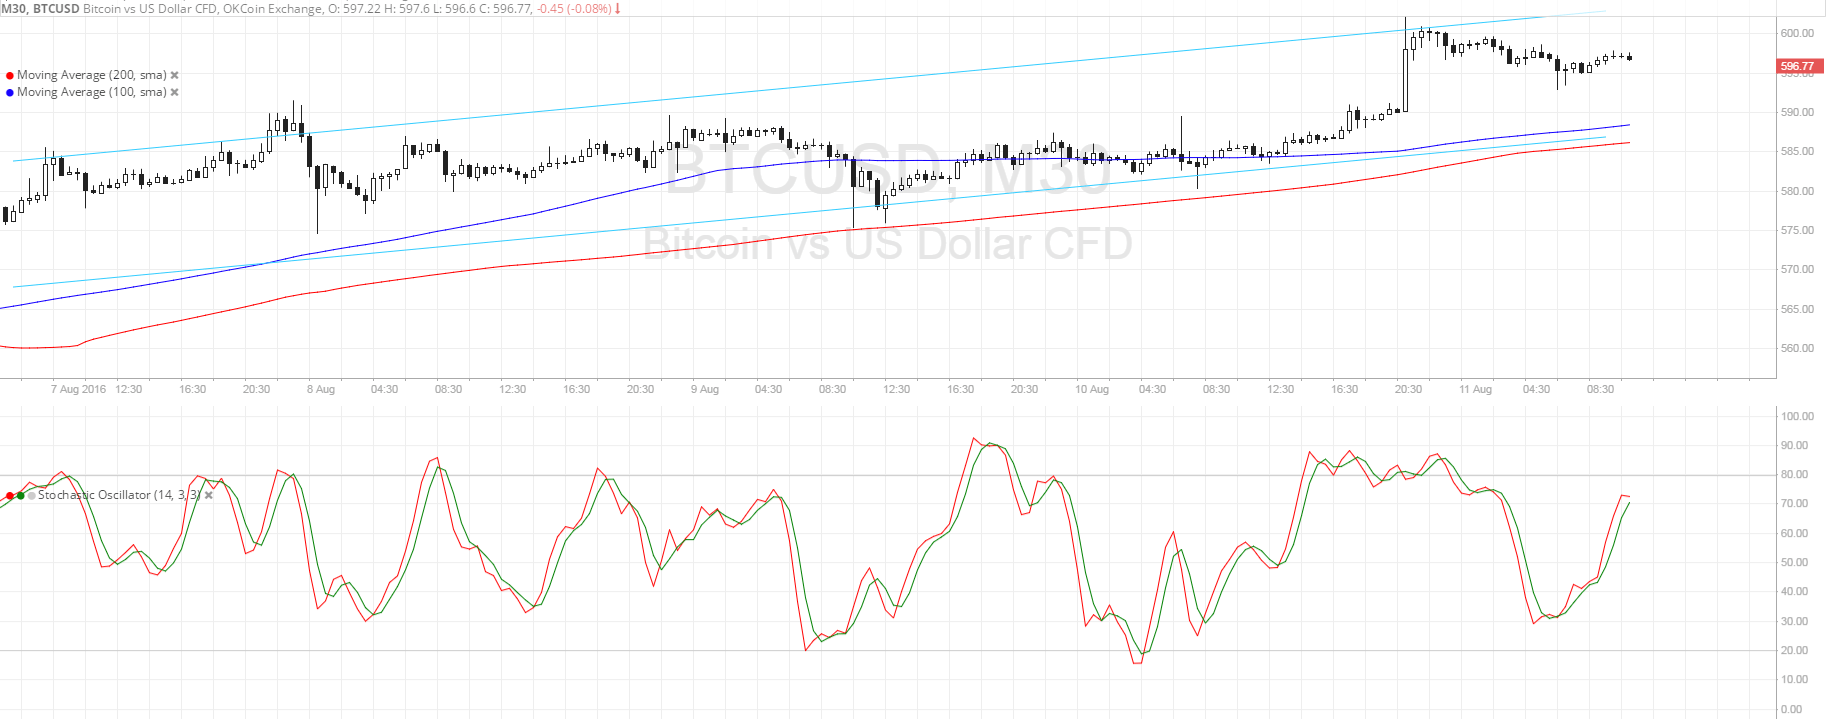
The 100 SMA is still above the 200 SMA so the path of least resistance is to the upside, which means that the uptrend could resume. However, the gap between the moving averages is narrowing, reflecting weakening bullish momentum. If a downward crossover occurs, bitcoin price might even try to break below support at $590.
Note, however, that the moving averages are in line with the bottom of the channel, adding to its strength as a floor. A move below support could still bounce off the 200 SMA closer to $585.
Meanwhile, stochastic is on the move up to show that buyers are in control of price action. In that case, bitcoin price could resume its climb upon testing the mid-channel area of interest at $595 then go for a test of resistance near $605 again.

Market Events
Dollar weakness seems to be in play these days as risk appetite is picking up. Markets have been shrugging off the upbeat jobs figures from the US economy, namely the quarterly non-farm productivity and unit labor costs, as well as the JOLTS job openings figures.
In addition, traders are still in the process of recovering from the sharp drop in bitcoin price following the Bitfinex hack earlier on. The cryptocurrency is showing increased momentum towards retesting the broken long-term support near $650, which might hold as resistance later on.
Potential catalysts for the rest of the week include changes in overall market sentiment, perhaps influenced by falling commodity prices, and the upcoming US retail sales release on Friday. Slower consumer spending growth is eyed so downbeat data could lead to more dollar losses against bitcoin.
Charts from SimpleFX