Bitcoin Price Key Highlights
- Bitcoin price appears to be slowing from its climb and might be forming a short-term reversal pattern.
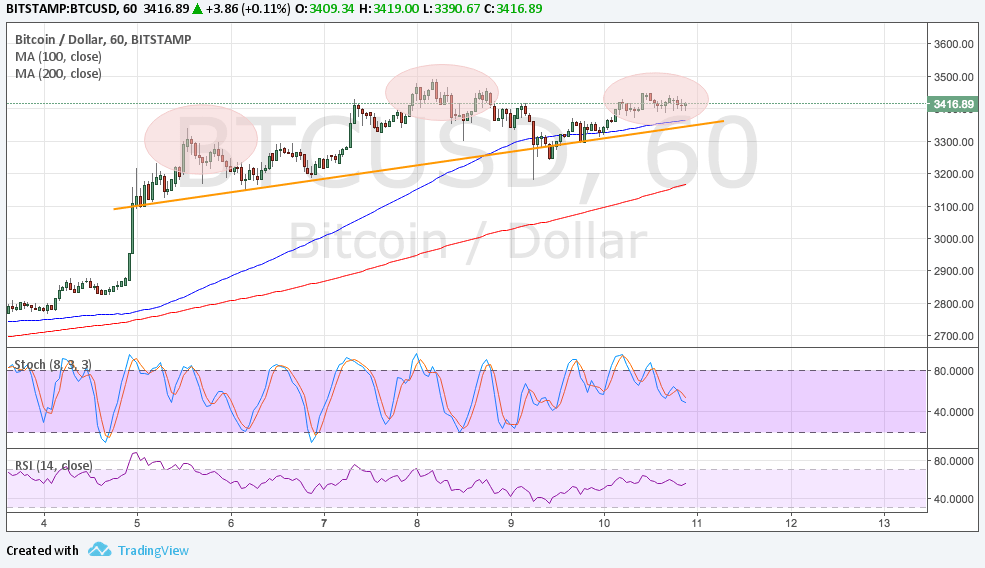
- A complex head and shoulders could be completed on the 1-hour time frame but bitcoin is still forming its right shoulder.
- A break below the neckline could confirm that a larger correction is due before the uptrend resumes.
Bitcoin price appears to be completing its head and shoulders formation on the short-term chart to signal a larger correction from its rally.
Technical Indicators Signals
The 100 SMA is above the longer-term 200 SMA on this chart so the path of least resistance is to the upside. Also, the 100 SMA dynamic support lines up with the potential neckline around $3400, adding to its strength as a floor. A break below this area could send bitcoin price down to the next dynamic inflection point at $3200 near the 200 SMA.
Stochastic is on the move down so bitcoin price might follow suit while selling pressure is in play. RSI is treading mostly sideways but looks ready to head south as well. The chart pattern spans $3200 to $3500 so the resulting fall could be of the same height, possibly taking bitcoin price for a retest of the area of interest around $3000.

Market Factors
Fundamentals and market sentiment appear to be strongly in support of more bitcoin price gains from here. Geopolitical risk from North Korea’s missile strike tests on Guam could keep traders on the hunt for higher returns outside of stock markets, especially since US equity indices just logged in their second worst day so far this year.
Dollar demand has also tanked after seeing downbeat PPI readings, which spurred expectations of weak CPI and a delay in the next Fed rate hike. A number of policymakers have repeatedly expressed concerns about weak inflation and the likelihood of starting the balance sheet runoff next month could also push the next hike back to December.
Meanwhile, bitcoin price is also drawing support from the lack of negative updates related to the hard fork and network upgrade, sustaining demand and usage among firms and investors.