Bitcoin Price Key Highlights
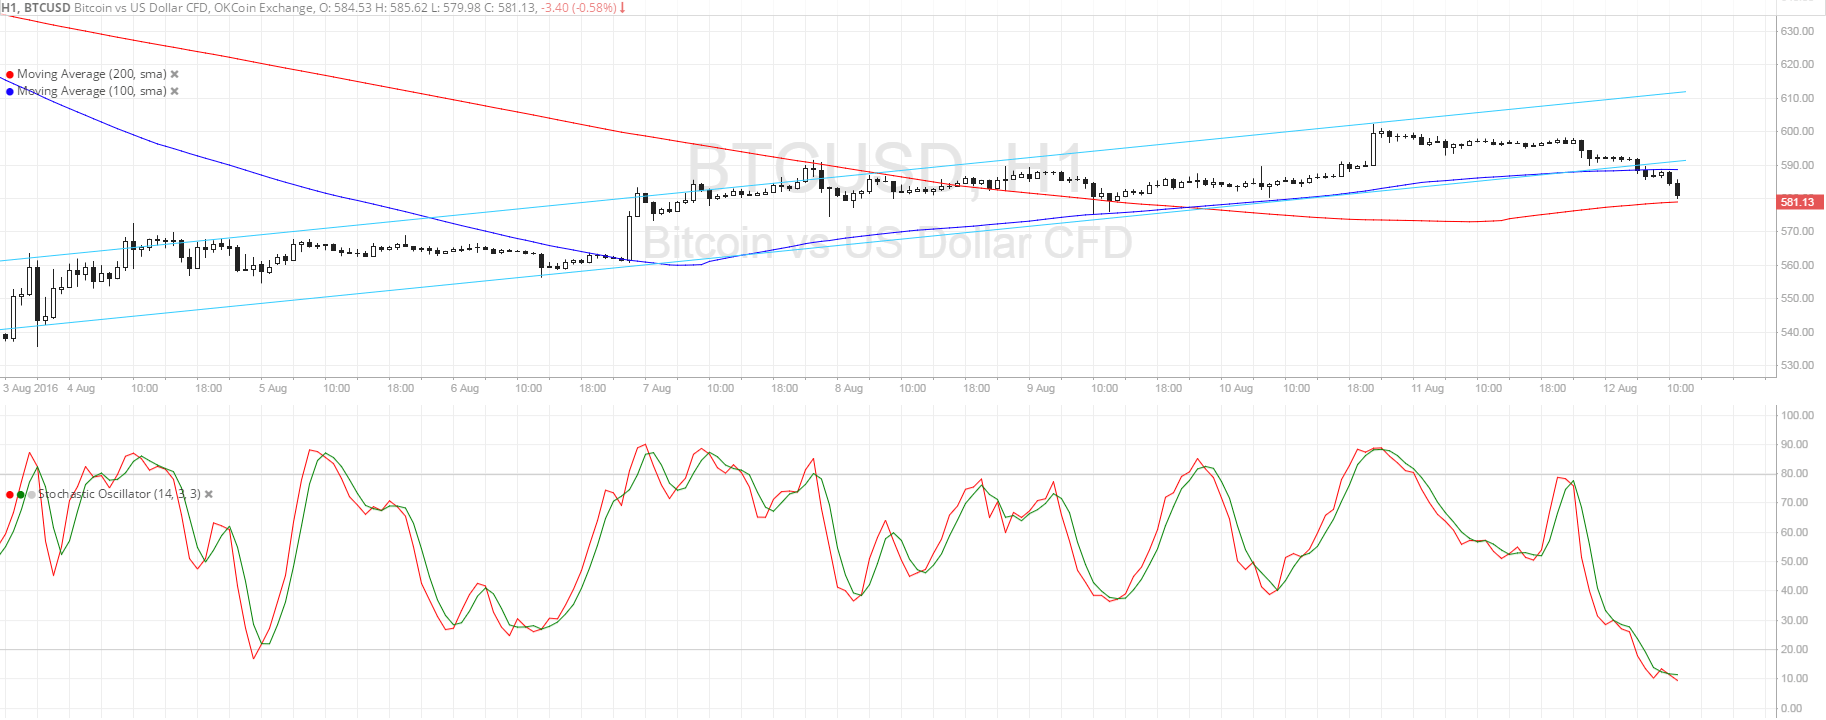
- Bitcoin price was previously trending higher on its short-term time frames, moving inside an ascending channel visible on the 30-min and 1-hour charts.
- Price was rejected on its test of resistance and made its way back down to the channel support as expected.
- However, this floor broke down, signaling that a reversal from the uptrend may be in order.
Bitcoin price could be in for a selloff now that it broke below the short-term channel support and is testing the next inflection point.
Technical Indicators Signals
The 100 SMA is still above the longer-term 200 SMA so there could be a chance for a bounce. However, price has already dipped below the dynamic support at the 100 SMA and looks ready to break below the 200 SMA as well, setting the stage for a potential downward crossover later on.
Stochastic is deep in the oversold region, which means that sellers are starting to get exhausted. The oscillator has yet to cross higher and make its way out of the oversold area before it indicates a return in buying momentum. If a bounce takes place, bitcoin price could simply retest the broken channel support around $590 before resuming its drop.

Market Events
US equities ended in the green once more, renewing demand for the dollar versus other assets such as bitcoin. Economic reports from the US have been surpassing expectations these days, keeping hopes up for a Fed interest rate hike in September or December.
US retail sales data are up for release today and analysts are expecting to see a 0.4% increase in the headline figure and a 0.2% uptick for the core version of the report, both weaker than the previous 0.6% and 0.7% gains respectively. However, if the actual readings beat expectations, the US dollar could gain more traction in its climb.
On the other hand, downbeat consumer spending data could dash hopes of a Fed rate hike before the end of the year, renewing demand for alternative assets such as bitcoin. Zooming out to longer-term time frames shows that the uptrend might still be intact, keeping bitcoin price on track for more upside later on.
Charts from SimpleFX