Bitcoin Price Key Highlights
- Bitcoin price was previously consolidating inside a rising wedge pattern as traders were waiting for more momentum.
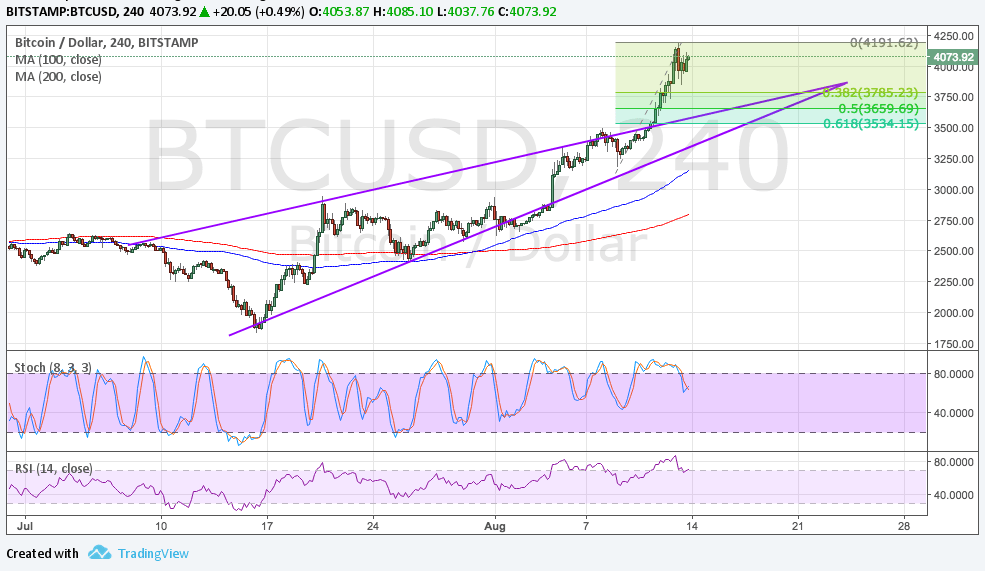
- Price just broke past the wedge resistance to test record highs close to $4200.
- Bitcoin might be due for a pullback to the broken wedge top before heading further north.
Bitcoin price made a strong upside break outside of its consolidation pattern to signal that further gains are in the cards.
Technical Indicators Signals
The 100 SMA is above the longer-term 200 SMA on the 4-hour chart so the path of least resistance is to the upside. The gap between the moving averages is widening to reflect strengthening bullish momentum.
However, stochastic is turning lower to reflect a return in selling pressure. RSI is also pointing down so it could draw more bears back in. This could pave the way for a pullback to the Fibs at the broken wedge resistance or the $3500 mark near the 61.8% level.

Market Factors
The pickup in geopolitical risk has sustained bitcoin price rallies as investors search for higher yields in times of uncertainty. Stocks have been weakening and so have commodities as traders are worried that these markets could take huge hits in the event of a nuclear war.
So far, there have been no signs of backing down or taking a diplomatic stance from either the U.S. or North Korea as the “war of words” continues. Escalating tensions and threats could continue to drive traders away from traditional markets and onto the likes of bitcoin and ethereum.
The former has drawn more demand after recently surviving its hard fork unscathed. This upgrade has allowed bitcoin to handle more transactions in the network anyway, rendering it a superior choice among its cryptocurrency peers.
Apart from that, the increase in funding for the likes of Coinbase and Filecoin has sustained investor interest in bitcoin. Strong demand from Japanese investors, in particular, has been credited for the latest surge in bitcoin price.