Bitcoin Price Key Highlights
- Bitcoin price is still trending lower on its short-term charts, following a break below consolidation and reversal formations.
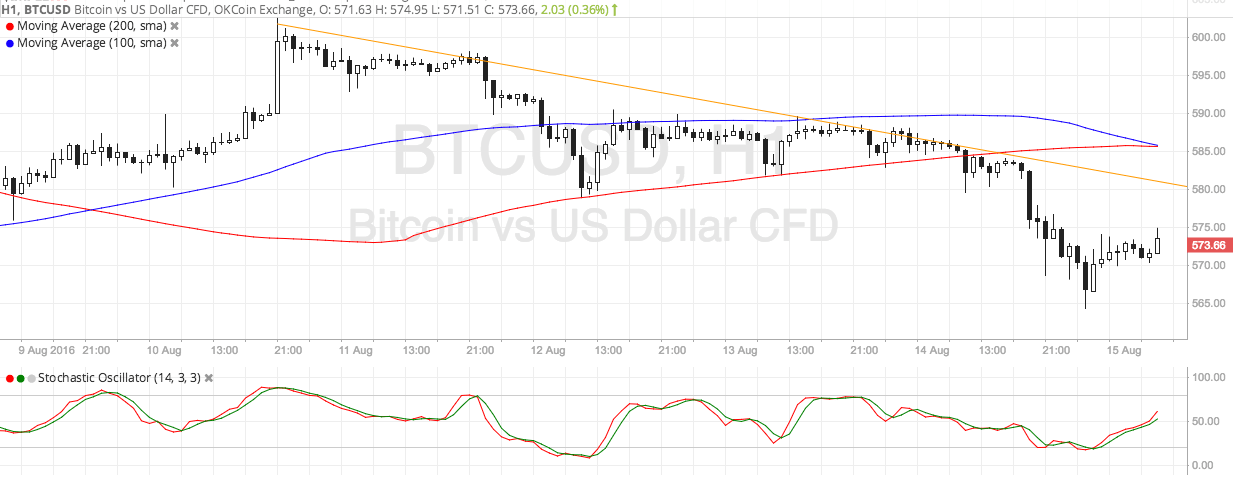
- Price could pull up to the descending trend line on the 1-hour chart before resuming its slide, giving sellers an opportunity to catch the downtrend at a better price.
- Technical indicators are confirming that a downtrend could be in the works.
Bitcoin price could continue to drop after completing a correction to the area of interest at $580.
Technical Indicators Signals
The 100 SMA is making a downward crossover from the 200 SMA to show that bearish pressure is getting stronger. Once this downtrend signal is completed, more sellers could jump in the game and push for a test of the recent lows at $565.
Bitcoin price could find resistance at the descending trend line connecting the latest highs of price action since August 10, as this lines up with a former support zone around $580. A move past this area could still draw resistance from the dynamic inflection points around the moving averages.
Stochastic is still heading up, which suggests that buyers are still in control of bitcoin price action for now but could let sellers take over once the oscillator reaches the overbought region and turns lower. Stronger bearish momentum could even lead to a break of the previous lows and a drop to new ones around $550.

Market Events
US retail sales data missed expectations on Friday but the dollar managed to advance against bitcoin price as risk aversion may have taken over. In these market scenarios, traders generally prefer safe-haven assets like the dollar versus higher-yielding and riskier ones like bitcoin.
Headline retail sales was flat while core retail sales posted a 0.3% drop. Producer prices also missed expectations, with the headline figure showing a 0.4% decline and the core figure printing a 0.3% drop. To top it off, the preliminary UoM consumer sentiment fell short of expectations as well.
Moving forward, the main event risks for the week include the FOMC minutes, ECB minutes, New Zealand jobs data, and UK top-tier releases (CPI, jobs, retail sales) which could determine whether further stimulus is warranted or not.